Citibank 2015 Annual Report Download - page 24
Download and view the complete annual report
Please find page 24 of the 2015 Citibank annual report below. You can navigate through the pages in the report by either clicking on the pages listed below, or by using the keyword search tool below to find specific information within the annual report.-
 1
1 -
2
-
3
-
4
-
5
-
6
-
7
-
8
-
9
-
10
-
11
-
12
-
13
-
 14
14 -
 15
15 -
 16
16 -
 17
17 -
 18
18 -
 19
19 -
 20
20 -
 21
21 -
 22
22 -
 23
23 -
 24
24 -
 25
25 -
 26
26 -
 27
27 -
 28
28 -
 29
29 -
 30
30 -
 31
31 -
 32
32 -
 33
33 -
 34
34 -
35
-
36
-
37
-
38
-
39
-
40
-
41
-
42
-
43
-
44
-
45
-
46
-
47
-
48
-
49
-
50
-
51
-
52
-
53
-
54
-
55
-
56
-
57
-
58
-
59
-
60
-
61
-
62
-
63
-
64
-
65
-
66
-
67
-
68
-
69
-
70
-
71
-
72
-
73
-
74
-
75
-
76
-
77
-
78
-
79
-
80
-
81
-
82
-
83
-
84
-
85
-
86
-
87
-
88
-
89
-
90
-
91
-
92
-
93
-
94
-
95
-
96
-
97
-
98
-
99
-
100
-
101
-
102
-
103
-
104
-
105
-
106
-
107
-
108
-
109
-
110
-
111
-
112
-
113
-
114
-
115
-
116
-
117
-
118
-
119
-
120
-
121
-
122
-
123
-
124
-
125
-
126
-
127
-
128
-
129
-
130
-
131
-
132
-
133
-
134
-
135
-
136
-
137
-
138
-
139
-
140
-
141
-
142
-
143
-
144
-
145
-
146
-
147
-
148
-
149
-
150
-
151
-
152
-
153
-
154
-
155
-
156
-
157
-
158
-
159
-
160
-
161
-
162
-
163
-
164
-
165
-
166
-
167
-
168
-
169
-
170
-
171
-
172
-
173
-
174
-
175
-
176
-
177
-
178
-
179
-
180
-
181
-
182
-
183
-
184
-
185
-
186
-
187
-
188
-
189
-
190
-
191
-
192
-
193
-
194
-
195
-
196
-
197
-
198
-
199
-
200
-
201
-
202
-
203
-
204
-
205
-
206
-
207
-
208
-
209
-
210
-
211
-
212
-
213
-
214
-
215
-
216
-
217
-
218
-
219
-
220
-
221
-
222
-
223
-
224
-
225
-
226
-
227
-
228
-
229
-
230
-
231
-
232
-
233
-
234
-
235
-
236
-
237
-
238
-
239
-
240
-
241
-
242
-
243
-
244
-
245
-
246
-
247
-
248
-
249
-
250
-
251
-
252
-
253
-
254
-
255
-
256
-
257
-
258
-
259
-
260
-
261
-
262
-
263
-
264
-
265
-
266
-
267
-
268
-
269
-
270
-
271
-
272
-
273
-
274
-
275
-
276
-
277
-
278
-
279
-
280
-
281
-
282
-
283
-
284
-
285
-
286
-
287
-
288
-
289
-
290
-
291
-
292
-
293
-
294
-
295
-
296
-
297
-
298
-
299
-
300
-
301
-
302
-
303
-
304
-
305
-
306
-
307
-
308
-
309
-
310
-
311
-
312
-
313
-
314
-
315
-
316
-
317
-
318
-
319
-
320
-
321
-
322
-
323
-
324
-
325
-
326
-
327
-
328
-
329
-
330
-
331
-
332
 |
 |
6
EXECUTIVE SUMMARY
Citi’s full year 2015 results of operations reflected a solid overall performance.
As described in more detail throughout this Executive Summary, Citi’s full
year 2015 net income of $17.1 billion was its highest since pre-financial
crisis, when Citi was a very different company in terms of footprint, mix of
businesses and assets. During the year, Citi was able to grow revenues by
3% and make investments in its core Citicorp businesses while reducing
its overall expenses, thus improving its overall efficiency ratio. Loan and
deposit growth in Citicorp each grew by 5% while Citi’s overall balance sheet
decreased by 3% (each excluding the impact of foreign currency translation
into U.S. dollars for reporting purposes (FX translation)). Citi also ended
2015 with a Common Equity Tier 1 Capital ratio, on a fully implemented
basis, of 12.1%.
In addition to these accomplishments, Citi made significant progress on
its execution priorities during 2015, including:
• Efficient resource allocation and disciplined expense management: As
described above, Citi maintained disciplined expense management during
2015, even as it continued to absorb increased regulatory and compliance
costs in Citicorp and made ongoing business investments. Citi’s expense
management during 2015 was further aided by lower legal and related
expenses and lower repositioning expenses in Citicorp as compared to the
prior year, as discussed further below.
• Continued wind down of Citi Holdings, while maintaining profitability:
Citi significantly reduced the assets in Citi Holdings during the year. Citi
Holdings’ assets decreased $55 billion, or 43%, from 2014, ending the year
at $74 billion. In addition, as of December 31, 2015, Citi had executed
agreements to further reduce Citi Holdings GAAP assets by approximately
$7 billion in 2016 (for additional information, see “Citi Holdings” below).
As discussed further below, Citi Holdings also maintained profitability
in 2015.
• Utilization of deferred tax assets (DTAs): Citi utilized approximately
$1.5 billion in DTAs during 2015 (for additional information, see
“Significant Accounting Policies and Significant Estimates—Income
Taxes” below and Note 9 to the Consolidated Financial Statements).
Citi was able to achieve these results and make ongoing progress on its
execution priorities during a year with market volatility and uncertainties,
including macroeconomic uncertainties, slower global growth and market
volatility resulting from, among other things, lower commodity prices as well
as uncertainty regarding the timing and pace of U.S. interest rate changes.
As the year-to-date has shown, Citi expects the operating environment in
2016 to remain challenging, with many of the uncertainties impacting its
results of operations during 2015 continuing into 2016. For a more detailed
discussion of the risks and uncertainties that could impact Citi’s businesses,
results of operations and financial condition during 2016, see each respective
business’ results of operations, “Risk Factors” and “Managing Global Risk”
below. While Citi may not be able to control all aspects of its operating
environment in 2016, it intends to continue to build on the progress made
during 2015 by remaining focused on its execution priorities and target
client strategy.
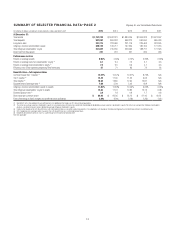
2015 Summary Results
Citigroup
Citigroup reported net income of $17.2 billion or $5.40 per share, compared
to $7.3 billion or $2.20 per share in the prior year. Results in 2015 included
$254 million ($162 million after-tax) of CVA/DVA, compared to negative
$390 million (negative $240 million after-tax) in 2014. Citigroup full year
2014 results also included a charge of $3.8 billion ($3.7 billion after-tax)
to settle RMBS and CDO-related claims recorded in Citi Holdings and
a tax charge of $210 million related to corporate tax reforms recorded
in Corporate/Other.
Excluding the impact of CVA/DVA in both periods as well as the impact
of the mortgage settlement and the tax item in 2014, Citigroup reported
net income of $17.1 billion in 2015, or $5.35 per share, compared to
$11.5 billion, or $3.55 per share, in the prior year. (Citi’s results of operations
excluding the impact of CVA/DVA as well as the impact of the mortgage
settlement and the tax item in 2014 are non-GAAP financial measures. Citi
believes the presentation of its results of operations excluding these impacts
provides a more meaningful depiction for investors of the underlying
fundamentals of its businesses.) The 49% increase from the prior year was
primarily driven by lower expenses and lower net credit losses, partially offset
by lower revenues and a reduced net loan loss reserve release.
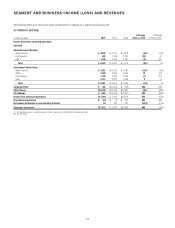
Citi’s revenues were $76.4 billion in 2015, a decrease of 1% from
the prior year. Excluding CVA/DVA, revenues were $76.1 billion, down
2% from the prior year, as Citicorp revenues decreased by 2% and Citi
Holdings revenues decreased 1%. Excluding CVA/DVA and the impact
of FX translation, Citigroup revenues increased 3% from the prior
MANAGEMENT’S DISCUSSION AND ANALYSIS OF FINANCIAL CONDITION AND
RESULTS OF OPERATIONS