Citibank 2015 Annual Report Download - page 154
Download and view the complete annual report
Please find page 154 of the 2015 Citibank annual report below. You can navigate through the pages in the report by either clicking on the pages listed below, or by using the keyword search tool below to find specific information within the annual report.-
 1
1 -
2
-
3
-
4
-
5
-
6
-
7
-
8
-
9
-
10
-
11
-
12
-
13
-
14
-
15
-
16
-
17
-
18
-
19
-
20
-
21
-
22
-
23
-
24
-
25
-
26
-
27
-
28
-
29
-
30
-
31
-
32
-
33
-
34
-
35
-
36
-
37
-
38
-
39
-
40
-
41
-
42
-
43
-
44
-
45
-
46
-
47
-
48
-
49
-
50
-
51
-
52
-
53
-
54
-
55
-
56
-
57
-
58
-
59
-
60
-
61
-
62
-
63
-
64
-
65
-
66
-
67
-
68
-
69
-
70
-
71
-
72
-
73
-
74
-
75
-
76
-
77
-
78
-
79
-
80
-
81
-
82
-
83
-
84
-
85
-
86
-
87
-
88
-
89
-
90
-
91
-
92
-
93
-
94
-
95
-
96
-
97
-
98
-
99
-
100
-
101
-
102
-
103
-
104
-
105
-
106
-
107
-
108
-
109
-
110
-
111
-
112
-
113
-
114
-
115
-
116
-
117
-
118
-
119
-
120
-
121
-
122
-
123
-
124
-
125
-
126
-
127
-
128
-
129
-
130
-
131
-
132
-
133
-
134
-
135
-
136
-
137
-
138
-
139
-
140
-
141
-
142
-
143
-
 144
144 -
 145
145 -
 146
146 -
 147
147 -
 148
148 -
 149
149 -
 150
150 -
 151
151 -
 152
152 -
 153
153 -
 154
154 -
 155
155 -
 156
156 -
 157
157 -
 158
158 -
 159
159 -
 160
160 -
 161
161 -
 162
162 -
 163
163 -
 164
164 -
165
-
166
-
167
-
168
-
169
-
170
-
171
-
172
-
173
-
174
-
175
-
176
-
177
-
178
-
179
-
180
-
181
-
182
-
183
-
184
-
185
-
186
-
187
-
188
-
189
-
190
-
191
-
192
-
193
-
194
-
195
-
196
-
197
-
198
-
199
-
200
-
201
-
202
-
203
-
204
-
205
-
206
-
207
-
208
-
209
-
210
-
211
-
212
-
213
-
214
-
215
-
216
-
217
-
218
-
219
-
220
-
221
-
222
-
223
-
224
-
225
-
226
-
227
-
228
-
229
-
230
-
231
-
232
-
233
-
234
-
235
-
236
-
237
-
238
-
239
-
240
-
241
-
242
-
243
-
244
-
245
-
246
-
247
-
248
-
249
-
250
-
251
-
252
-
253
-
254
-
255
-
256
-
257
-
258
-
259
-
260
-
261
-
262
-
263
-
264
-
265
-
266
-
267
-
268
-
269
-
270
-
271
-
272
-
273
-
274
-
275
-
276
-
277
-
278
-
279
-
280
-
281
-
282
-
283
-
284
-
285
-
286
-
287
-
288
-
289
-
290
-
291
-
292
-
293
-
294
-
295
-
296
-
297
-
298
-
299
-
300
-
301
-
302
-
303
-
304
-
305
-
306
-
307
-
308
-
309
-
310
-
311
-
312
-
313
-
314
-
315
-
316
-
317
-
318
-
319
-
320
-
321
-
322
-
323
-
324
-
325
-
326
-
327
-
328
-
329
-
330
-
331
-
332
 |
 |

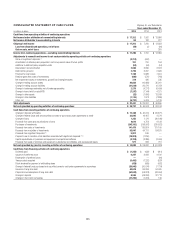
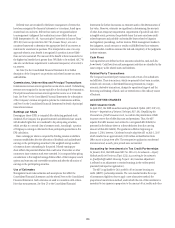
136
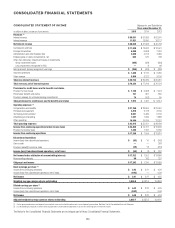
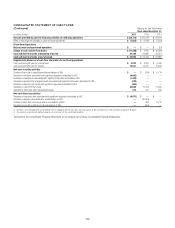
CONSOLIDATED STATEMENT OF CASH FLOWS
(Continued) Citigroup Inc. and Subsidiaries
Years ended December 31,
In millions of dollars 2015 2014 2013
Net cash provided by (used in) financing activities of continuing operations $ (64,773) $ (70,270) $ 23,094
Effect of exchange rate changes on cash and cash equivalents $ (1,055) $ (2,432) $ (1,558)
Discontinued operations
Net cash used in discontinued operations $ — $ — $ (10)
Change in cash and due from banks $ (11,208) $ 2,223 $ (6,568)
Cash and due from banks at beginning of period 32,108 29,885 36,453
Cash and due from banks at end of period $ 20,900 $ 32,108 $ 29,885
Supplemental disclosure of cash flow information for continuing operations
Cash paid during the year for income taxes $ 4,978 $ 4,632 $ 4,495
Cash paid during the year for interest 12,031 14,001 15,655
Non-cash investing activities
Change in loans due to consolidation/deconsolidation of VIEs $ — $ (374) $ 6,718
Decrease in net loans associated with significant disposals reclassified to HFS (9,063) — —
Decrease in investments associated with significant disposals reclassified to HFS (1,402) — —
Decrease in goodwill and intangible assets associated with significant disposals reclassified to HFS (223) — —
Decrease in deposits with banks with significant disposals reclassified to HFS (404) — —
Transfers to loans HFS from loans 28,600 15,100 17,300
Transfers to OREO and other repossessed assets 276 321 325
Non-cash financing activities
Decrease in long-term debt associated with significant disposals reclassified to HFS $ (4,673) $ — $ —
Decrease in deposits associated with reclassification to HFS —(20,605) —
Increase in short-term borrowings due to consolidation of VIEs —500 6,718
Decrease in long-term debt due to deconsolidation of VIEs —(864) —
(1) See Note 1 to the Consolidated Financial Statements for the adoption of ASU No. 2014-08 in the second quarter of 2014 and Note 2 for further information on significant disposals.
(2) The payments associated with significant disposals result primarily from the sale of deposit liabilities.
The Notes to the Consolidated Financial Statements are an integral part of these Consolidated Financial Statements.