Citibank 2015 Annual Report Download - page 40
Download and view the complete annual report
Please find page 40 of the 2015 Citibank annual report below. You can navigate through the pages in the report by either clicking on the pages listed below, or by using the keyword search tool below to find specific information within the annual report.-
 1
1 -
2
-
3
-
4
-
5
-
6
-
7
-
8
-
9
-
10
-
11
-
12
-
13
-
14
-
15
-
16
-
17
-
18
-
19
-
20
-
21
-
22
-
23
-
24
-
25
-
26
-
27
-
28
-
29
-
 30
30 -
 31
31 -
 32
32 -
 33
33 -
 34
34 -
 35
35 -
 36
36 -
 37
37 -
 38
38 -
 39
39 -
 40
40 -
 41
41 -
 42
42 -
 43
43 -
 44
44 -
 45
45 -
 46
46 -
 47
47 -
 48
48 -
 49
49 -
 50
50 -
51
-
52
-
53
-
54
-
55
-
56
-
57
-
58
-
59
-
60
-
61
-
62
-
63
-
64
-
65
-
66
-
67
-
68
-
69
-
70
-
71
-
72
-
73
-
74
-
75
-
76
-
77
-
78
-
79
-
80
-
81
-
82
-
83
-
84
-
85
-
86
-
87
-
88
-
89
-
90
-
91
-
92
-
93
-
94
-
95
-
96
-
97
-
98
-
99
-
100
-
101
-
102
-
103
-
104
-
105
-
106
-
107
-
108
-
109
-
110
-
111
-
112
-
113
-
114
-
115
-
116
-
117
-
118
-
119
-
120
-
121
-
122
-
123
-
124
-
125
-
126
-
127
-
128
-
129
-
130
-
131
-
132
-
133
-
134
-
135
-
136
-
137
-
138
-
139
-
140
-
141
-
142
-
143
-
144
-
145
-
146
-
147
-
148
-
149
-
150
-
151
-
152
-
153
-
154
-
155
-
156
-
157
-
158
-
159
-
160
-
161
-
162
-
163
-
164
-
165
-
166
-
167
-
168
-
169
-
170
-
171
-
172
-
173
-
174
-
175
-
176
-
177
-
178
-
179
-
180
-
181
-
182
-
183
-
184
-
185
-
186
-
187
-
188
-
189
-
190
-
191
-
192
-
193
-
194
-
195
-
196
-
197
-
198
-
199
-
200
-
201
-
202
-
203
-
204
-
205
-
206
-
207
-
208
-
209
-
210
-
211
-
212
-
213
-
214
-
215
-
216
-
217
-
218
-
219
-
220
-
221
-
222
-
223
-
224
-
225
-
226
-
227
-
228
-
229
-
230
-
231
-
232
-
233
-
234
-
235
-
236
-
237
-
238
-
239
-
240
-
241
-
242
-
243
-
244
-
245
-
246
-
247
-
248
-
249
-
250
-
251
-
252
-
253
-
254
-
255
-
256
-
257
-
258
-
259
-
260
-
261
-
262
-
263
-
264
-
265
-
266
-
267
-
268
-
269
-
270
-
271
-
272
-
273
-
274
-
275
-
276
-
277
-
278
-
279
-
280
-
281
-
282
-
283
-
284
-
285
-
286
-
287
-
288
-
289
-
290
-
291
-
292
-
293
-
294
-
295
-
296
-
297
-
298
-
299
-
300
-
301
-
302
-
303
-
304
-
305
-
306
-
307
-
308
-
309
-
310
-
311
-
312
-
313
-
314
-
315
-
316
-
317
-
318
-
319
-
320
-
321
-
322
-
323
-
324
-
325
-
326
-
327
-
328
-
329
-
330
-
331
-
332
 |
 |

22
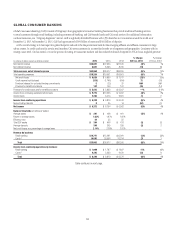
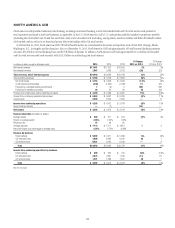
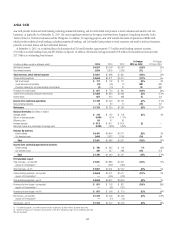
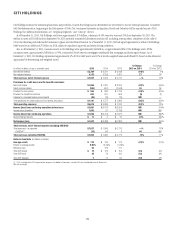
ASIA GCB
Asia GCB provides traditional retail banking, including commercial banking, and its Citi-branded card products to retail customers and small to mid-size
businesses, as applicable. As of December 31, 2015, Citi’s most significant revenues in the region were from Korea, Singapore, Hong Kong, Australia, India,
Taiwan, Malaysia, Thailand, Indonesia and the Philippines. In addition, for reporting purposes, Asia GCB includes the results of operations of EMEA GCB,
which provides traditional retail banking, including commercial banking, and Citi-branded card products to retail customers and small to mid-size businesses,
primarily in Poland, Russia and the United Arab Emirates.
At December 31, 2015, on a combined basis, the businesses had 520 retail branches, approximately 17.5 million retail banking customer accounts,
$71.0 billion in retail banking loans and $87.8 billion in deposits. In addition, the business had approximately 16.9 million Citi-branded card accounts with
$17.7 billion in outstanding loan balances.
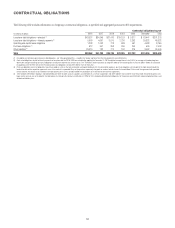
In millions of dollars, except as otherwise noted (1) 2015 2014 2013
% Change
2015 vs. 2014
% Change
2014 vs. 2013
Net interest revenue $4,557 $ 5,049 $ 5,163 (10)% (2)%
Non-interest revenue 2,534 2,839 2,768 (11) 3
Total revenues, net of interest expense $7,091 $ 7,888 $ 7,931 (10)% (1)%
Total operating expenses $4,634 $ 5,271 $ 5,017 (12)% 5%
Net credit losses $ 727 $ 793 $ 771 (8)% 3%
Credit reserve build (release) (73) (26) 19 NM NM
Provision (release) for unfunded lending commitments (3) (14) 31 79 NM
Provisions for credit losses $ 651 $ 753 $ 821 (14)% (8)%
Income from continuing operations before taxes $1,806 $ 1,864 $ 2,093 (3)% (11)%
Income taxes 607 615 686 (1) (10)
Income from continuing operations $1,199 $ 1,249 $ 1,407 (4)% (11)%
Noncontrolling interests 620 11 (70) 82
Net income $ 1,193 $ 1,229 $ 1,396 (3)% (12)%
Balance Sheet data (in billions of dollars)
Average assets $ 120 $ 122 $ 119 (2)% 3%
Return on average assets 0.99% 1.01% 1.17%
Efficiency ratio 65 67 63
Average deposits $ 87.9 $ 89.7 $ 89.4 (2) —
Net credit losses as a percentage of average loans 0.80% 0.82% 0.84%
Revenue by business
Retail banking $ 4,491 $ 4,866 $ 4,771 (8)% 2%
Citi-branded cards 2,600 3,022 3,160 (14) (4)
Total $7,091 $ 7,888 $ 7,931 (10)% (1)%
Income from continuing operations by business
Retail banking $ 740 $ 692 $ 719 7% (4)%
Citi-branded cards 459 557 688 (18) (19)
Total $1,199 $ 1,249 $ 1,407 (4)% (11)%
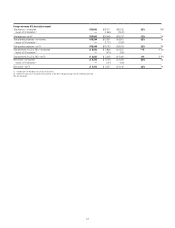
FX translation impact
Total revenues—as reported $7,091 $ 7,888 $ 7,931 (10)% (1)%
Impact of FX translation (2) —(587) (789)
Total revenues—ex-FX $7,091 $ 7,301 $ 7,142 (3)% 2%
Total operating expenses—as reported $ 4,634 $ 5,271 $ 5,017 (12)% 5%
Impact of FX translation (2) —(434) (478)
Total operating expenses—ex-FX $4,634 $ 4,837 $ 4,539 (4)% 7%
Provisions for loan losses—as reported $ 651 $ 753 $ 821 (14)% (8)%
Impact of FX translation (2) —(97) (102)
Provisions for loan losses—ex-FX $ 651 $ 656 $ 719 (1)% (9)%
Net income—as reported $1,193 $ 1,229 $ 1,396 (3)% (12)%
Impact of FX translation (2) —(17) (78)
Net income—ex-FX $ 1,193 $ 1,212 $ 1,318 (2)% (8)%
(1) For reporting purposes, Asia GCB includes the results of operations of EMEA GCB for all periods presented.
(2) Reflects the impact of FX translation into U.S. dollars at the 2015 average exchange rates for all periods presented.
NM Not meaningful