Citibank 2015 Annual Report Download - page 27
Download and view the complete annual report
Please find page 27 of the 2015 Citibank annual report below. You can navigate through the pages in the report by either clicking on the pages listed below, or by using the keyword search tool below to find specific information within the annual report.-
 1
1 -
2
-
3
-
4
-
5
-
6
-
7
-
8
-
9
-
10
-
11
-
12
-
13
-
14
-
15
-
16
-
 17
17 -
 18
18 -
 19
19 -
 20
20 -
 21
21 -
 22
22 -
 23
23 -
 24
24 -
 25
25 -
 26
26 -
 27
27 -
 28
28 -
 29
29 -
 30
30 -
 31
31 -
 32
32 -
 33
33 -
 34
34 -
 35
35 -
 36
36 -
 37
37 -
38
-
39
-
40
-
41
-
42
-
43
-
44
-
45
-
46
-
47
-
48
-
49
-
50
-
51
-
52
-
53
-
54
-
55
-
56
-
57
-
58
-
59
-
60
-
61
-
62
-
63
-
64
-
65
-
66
-
67
-
68
-
69
-
70
-
71
-
72
-
73
-
74
-
75
-
76
-
77
-
78
-
79
-
80
-
81
-
82
-
83
-
84
-
85
-
86
-
87
-
88
-
89
-
90
-
91
-
92
-
93
-
94
-
95
-
96
-
97
-
98
-
99
-
100
-
101
-
102
-
103
-
104
-
105
-
106
-
107
-
108
-
109
-
110
-
111
-
112
-
113
-
114
-
115
-
116
-
117
-
118
-
119
-
120
-
121
-
122
-
123
-
124
-
125
-
126
-
127
-
128
-
129
-
130
-
131
-
132
-
133
-
134
-
135
-
136
-
137
-
138
-
139
-
140
-
141
-
142
-
143
-
144
-
145
-
146
-
147
-
148
-
149
-
150
-
151
-
152
-
153
-
154
-
155
-
156
-
157
-
158
-
159
-
160
-
161
-
162
-
163
-
164
-
165
-
166
-
167
-
168
-
169
-
170
-
171
-
172
-
173
-
174
-
175
-
176
-
177
-
178
-
179
-
180
-
181
-
182
-
183
-
184
-
185
-
186
-
187
-
188
-
189
-
190
-
191
-
192
-
193
-
194
-
195
-
196
-
197
-
198
-
199
-
200
-
201
-
202
-
203
-
204
-
205
-
206
-
207
-
208
-
209
-
210
-
211
-
212
-
213
-
214
-
215
-
216
-
217
-
218
-
219
-
220
-
221
-
222
-
223
-
224
-
225
-
226
-
227
-
228
-
229
-
230
-
231
-
232
-
233
-
234
-
235
-
236
-
237
-
238
-
239
-
240
-
241
-
242
-
243
-
244
-
245
-
246
-
247
-
248
-
249
-
250
-
251
-
252
-
253
-
254
-
255
-
256
-
257
-
258
-
259
-
260
-
261
-
262
-
263
-
264
-
265
-
266
-
267
-
268
-
269
-
270
-
271
-
272
-
273
-
274
-
275
-
276
-
277
-
278
-
279
-
280
-
281
-
282
-
283
-
284
-
285
-
286
-
287
-
288
-
289
-
290
-
291
-
292
-
293
-
294
-
295
-
296
-
297
-
298
-
299
-
300
-
301
-
302
-
303
-
304
-
305
-
306
-
307
-
308
-
309
-
310
-
311
-
312
-
313
-
314
-
315
-
316
-
317
-
318
-
319
-
320
-
321
-
322
-
323
-
324
-
325
-
326
-
327
-
328
-
329
-
330
-
331
-
332
 |
 |
9
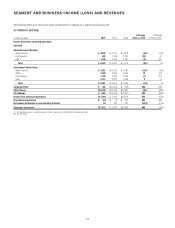
Markets and securities services revenues of $16.3 billion, excluding
CVA/DVA, decreased 1% from the prior year. Fixed income markets revenues
of $11.3 billion, excluding CVA/DVA, decreased 7% from the prior year,
as growth in rates and currencies was more than offset by a slowdown in
spread products, reflecting the volatile trading environment during the year.
Equity markets revenues of $3.1 billion, excluding CVA/DVA, increased 13%
versus the prior year driven by growth across all products. Securities services
revenues of $2.1 billion increased 4% versus the prior year, and increased 15%
excluding the impact of FX translation, reflecting increased client activity
and higher client balances. For additional information on the results of
operations of ICG for 2015, see “Institutional Clients Group” below.
Corporate/Other revenues increased to $907 million from $301 million in
the prior year, driven mainly by gains on debt buybacks during the course of
2015. For additional information on the results of operations of Corporate/
Other in 2015, see “Corporate/Other” below.
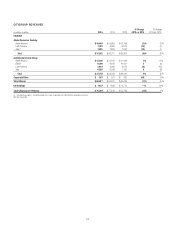
Citicorp end-of-period loans increased 1% to $573 billion from the
prior year, as a 5% increase in corporate loans was partially offset by a
2% decrease in consumer loans. Excluding the impact of FX translation,
Citicorp loans grew 5%, with 8% growth in corporate loans and 2% growth in
consumer loans.
Citi Holdings
Citi Holdings’ net income was $1.0 billion in 2015, compared to a net loss of
$3.5 billion in the prior year. CVA/DVA was negative $15 million (negative
$10 million after-tax) in 2015, compared to negative $47 million (negative
$29 million after-tax) in the prior year. Excluding the impact of CVA/DVA in
both periods and the impact of the mortgage settlement in the prior year, Citi
Holdings’ net income was $1.1 billion, compared to $275 million in the prior
year, primarily reflecting lower expenses and lower credit costs.
Citi Holdings’ revenues were largely unchanged from the prior year at
$7.8 billion. Excluding CVA/DVA, Citi Holdings’ revenues decreased 1% to
$7.9 billion from the prior year, primarily driven by the overall wind-down of
the portfolio and the impact of redemptions of high cost debt, mostly offset by
the impact of higher gains on asset sales. For additional information on the
results of operations of Citi Holdings in 2015, see “Citi Holdings” below.
At the end of 2015, Citi Holdings’ assets were $74 billion, 43% below the
prior year, and represented approximately 4% of Citi’s total GAAP assets.
Citi Holdings’ risk-weighted assets were $133 billion as of December 31,
2015, a decrease of 30% from the prior year, and represented 11% of Citi’s
risk-weighted assets under Basel III (based on the Advanced Approaches for
determining risk-weighted assets).