Citibank 2015 Annual Report Download - page 178
Download and view the complete annual report
Please find page 178 of the 2015 Citibank annual report below. You can navigate through the pages in the report by either clicking on the pages listed below, or by using the keyword search tool below to find specific information within the annual report.-
 1
1 -
2
-
3
-
4
-
5
-
6
-
7
-
8
-
9
-
10
-
11
-
12
-
13
-
14
-
15
-
16
-
17
-
18
-
19
-
20
-
21
-
22
-
23
-
24
-
25
-
26
-
27
-
28
-
29
-
30
-
31
-
32
-
33
-
34
-
35
-
36
-
37
-
38
-
39
-
40
-
41
-
42
-
43
-
44
-
45
-
46
-
47
-
48
-
49
-
50
-
51
-
52
-
53
-
54
-
55
-
56
-
57
-
58
-
59
-
60
-
61
-
62
-
63
-
64
-
65
-
66
-
67
-
68
-
69
-
70
-
71
-
72
-
73
-
74
-
75
-
76
-
77
-
78
-
79
-
80
-
81
-
82
-
83
-
84
-
85
-
86
-
87
-
88
-
89
-
90
-
91
-
92
-
93
-
94
-
95
-
96
-
97
-
98
-
99
-
100
-
101
-
102
-
103
-
104
-
105
-
106
-
107
-
108
-
109
-
110
-
111
-
112
-
113
-
114
-
115
-
116
-
117
-
118
-
119
-
120
-
121
-
122
-
123
-
124
-
125
-
126
-
127
-
128
-
129
-
130
-
131
-
132
-
133
-
134
-
135
-
136
-
137
-
138
-
139
-
140
-
141
-
142
-
143
-
144
-
145
-
146
-
147
-
148
-
149
-
150
-
151
-
152
-
153
-
154
-
155
-
156
-
157
-
158
-
159
-
160
-
161
-
162
-
163
-
164
-
165
-
166
-
167
-
 168
168 -
 169
169 -
 170
170 -
 171
171 -
 172
172 -
 173
173 -
 174
174 -
 175
175 -
 176
176 -
 177
177 -
 178
178 -
 179
179 -
 180
180 -
 181
181 -
 182
182 -
 183
183 -
 184
184 -
 185
185 -
 186
186 -
 187
187 -
 188
188 -
189
-
190
-
191
-
192
-
193
-
194
-
195
-
196
-
197
-
198
-
199
-
200
-
201
-
202
-
203
-
204
-
205
-
206
-
207
-
208
-
209
-
210
-
211
-
212
-
213
-
214
-
215
-
216
-
217
-
218
-
219
-
220
-
221
-
222
-
223
-
224
-
225
-
226
-
227
-
228
-
229
-
230
-
231
-
232
-
233
-
234
-
235
-
236
-
237
-
238
-
239
-
240
-
241
-
242
-
243
-
244
-
245
-
246
-
247
-
248
-
249
-
250
-
251
-
252
-
253
-
254
-
255
-
256
-
257
-
258
-
259
-
260
-
261
-
262
-
263
-
264
-
265
-
266
-
267
-
268
-
269
-
270
-
271
-
272
-
273
-
274
-
275
-
276
-
277
-
278
-
279
-
280
-
281
-
282
-
283
-
284
-
285
-
286
-
287
-
288
-
289
-
290
-
291
-
292
-
293
-
294
-
295
-
296
-
297
-
298
-
299
-
300
-
301
-
302
-
303
-
304
-
305
-
306
-
307
-
308
-
309
-
310
-
311
-
312
-
313
-
314
-
315
-
316
-
317
-
318
-
319
-
320
-
321
-
322
-
323
-
324
-
325
-
326
-
327
-
328
-
329
-
330
-
331
-
332
 |
 |

160
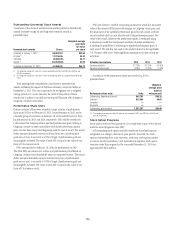
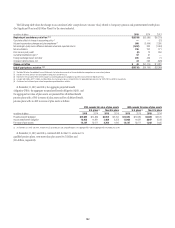
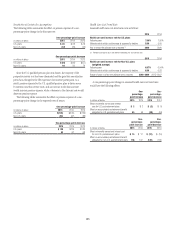
Contributions
The Company’s funding practice for U.S. and non-U.S. pension and
postretirement plans is generally to fund to minimum funding requirements
in accordance with applicable local laws and regulations. The Company
may increase its contributions above the minimum required contribution, if
appropriate. In addition, management has the ability to change its funding
practices. For the U.S. pension plans, there were no required minimum cash
contributions for 2015 or 2014.
The following table summarizes the actual Company contributions for
the years ended December 31, 2015 and 2014, as well as estimated expected
Company contributions for 2016. Expected contributions are subject to
change since contribution decisions are affected by various factors, such as
market performance and regulatory requirements.
Summary of Company Contributions
Pension plans (1) Postretirement benefit plans (1)
U.S. plans (2) Non-U.S. plans U.S. plans Non-U.S. plans
In millions of dollars 2016 2015 2014 2016 2015 2014 2016 2015 2014 2016 2015 2014
Contributions made by the Company $— $— $100 $78 $92 $130 $— $174 $— $3 $4 $6
Benefits paid directly by the Company 55 52 58 59 42 100 — 61 56 6 56
(1) Amounts reported for 2016 are expected amounts.
(2) The U.S. pension plans include benefits paid directly by the Company for the nonqualified pension plans.
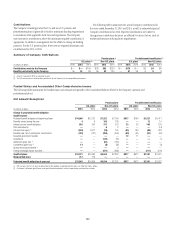
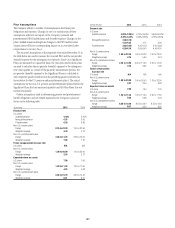
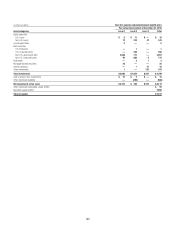
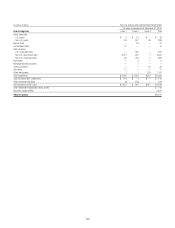
Funded Status and Accumulated Other Comprehensive Income
The following tables summarize the funded status and amounts recognized in the Consolidated Balance Sheet for the Company’s pension and
postretirement plans.
Net Amount Recognized
Pension plans Postretirement benefit plans
U.S. plans Non-U.S. plans U.S. plans Non-U.S. plans
In millions of dollars 2015 2014 2015 2014 2015 2014 2015 2014
Change in projected benefit obligation
Qualified plans
Projected benefit obligation at beginning of year $14,060 $12,137 $7,252 $7,194 $917 $780 $1,527 $1,411
Benefits earned during the year 46168 178 ——12 15
Interest cost on benefit obligation 553 541 317 376 33 33 108 120
Plan amendments ——62———(14)
Actuarial loss (gain) (1) (649) 2,077 (28) 790 (55) 184 (88) 262
Benefits paid, net of participants’ contributions (751) (701) (294) (352) (90) (91) (57) (93)
Expected government subsidy ————12 11 ——
Divestitures ——(147) (18) ———(1)
Settlement (gain) loss (2) ——(61) (184) ————
Curtailment (gain) loss (2) 14 —(8) (58) ———(3)
Special termination benefits (2) ———9————
Foreign exchange impact and other ——(671) (685) ——(211) (170)
Qualified plans $13,231 $14,060 $6,534 $7,252 $817 $917 $1,291 $1,527
Nonqualified plans 712 779 ——————
Projected benefit obligation at year end $13,943 $14,839 $6,534 $7,252 $817 $917 $1,291 $1,527
(1) 2014 amounts for the U.S. plans include impact of the adoption of updated mortality tables (see “Mortality Tables” below).
(2) Curtailment, settlement (gains)/losses and special termination benefits relate to repositioning and divestiture activities.