Citibank 2015 Annual Report Download - page 205
Download and view the complete annual report
Please find page 205 of the 2015 Citibank annual report below. You can navigate through the pages in the report by either clicking on the pages listed below, or by using the keyword search tool below to find specific information within the annual report.-
 1
1 -
2
-
3
-
4
-
5
-
6
-
7
-
8
-
9
-
10
-
11
-
12
-
13
-
14
-
15
-
16
-
17
-
18
-
19
-
20
-
21
-
22
-
23
-
24
-
25
-
26
-
27
-
28
-
29
-
30
-
31
-
32
-
33
-
34
-
35
-
36
-
37
-
38
-
39
-
40
-
41
-
42
-
43
-
44
-
45
-
46
-
47
-
48
-
49
-
50
-
51
-
52
-
53
-
54
-
55
-
56
-
57
-
58
-
59
-
60
-
61
-
62
-
63
-
64
-
65
-
66
-
67
-
68
-
69
-
70
-
71
-
72
-
73
-
74
-
75
-
76
-
77
-
78
-
79
-
80
-
81
-
82
-
83
-
84
-
85
-
86
-
87
-
88
-
89
-
90
-
91
-
92
-
93
-
94
-
95
-
96
-
97
-
98
-
99
-
100
-
101
-
102
-
103
-
104
-
105
-
106
-
107
-
108
-
109
-
110
-
111
-
112
-
113
-
114
-
115
-
116
-
117
-
118
-
119
-
120
-
121
-
122
-
123
-
124
-
125
-
126
-
127
-
128
-
129
-
130
-
131
-
132
-
133
-
134
-
135
-
136
-
137
-
138
-
139
-
140
-
141
-
142
-
143
-
144
-
145
-
146
-
147
-
148
-
149
-
150
-
151
-
152
-
153
-
154
-
155
-
156
-
157
-
158
-
159
-
160
-
161
-
162
-
163
-
164
-
165
-
166
-
167
-
168
-
169
-
170
-
171
-
172
-
173
-
174
-
175
-
176
-
177
-
178
-
179
-
180
-
181
-
182
-
183
-
184
-
185
-
186
-
187
-
188
-
189
-
190
-
191
-
192
-
193
-
194
-
 195
195 -
 196
196 -
 197
197 -
 198
198 -
 199
199 -
 200
200 -
 201
201 -
 202
202 -
 203
203 -
 204
204 -
 205
205 -
 206
206 -
 207
207 -
 208
208 -
 209
209 -
 210
210 -
 211
211 -
 212
212 -
 213
213 -
 214
214 -
 215
215 -
216
-
217
-
218
-
219
-
220
-
221
-
222
-
223
-
224
-
225
-
226
-
227
-
228
-
229
-
230
-
231
-
232
-
233
-
234
-
235
-
236
-
237
-
238
-
239
-
240
-
241
-
242
-
243
-
244
-
245
-
246
-
247
-
248
-
249
-
250
-
251
-
252
-
253
-
254
-
255
-
256
-
257
-
258
-
259
-
260
-
261
-
262
-
263
-
264
-
265
-
266
-
267
-
268
-
269
-
270
-
271
-
272
-
273
-
274
-
275
-
276
-
277
-
278
-
279
-
280
-
281
-
282
-
283
-
284
-
285
-
286
-
287
-
288
-
289
-
290
-
291
-
292
-
293
-
294
-
295
-
296
-
297
-
298
-
299
-
300
-
301
-
302
-
303
-
304
-
305
-
306
-
307
-
308
-
309
-
310
-
311
-
312
-
313
-
314
-
315
-
316
-
317
-
318
-
319
-
320
-
321
-
322
-
323
-
324
-
325
-
326
-
327
-
328
-
329
-
330
-
331
-
332
 |
 |

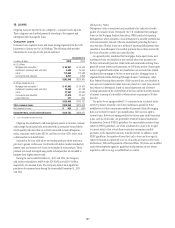
187
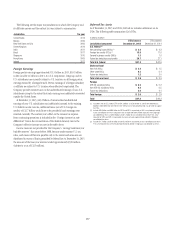
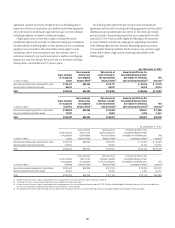
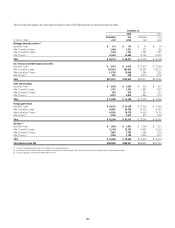
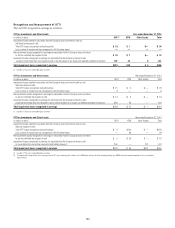
The table below shows the fair value of AFS securities that have been in an unrealized loss position for less than 12 months or for 12 months or longer:
Less than 12 months 12 months or longer Total
In millions of dollars
Fair
value
Gross
unrealized
losses
Fair
value
Gross
unrealized
losses
Fair
value
Gross
unrealized
losses
December 31, 2015
Securities AFS
Mortgage-backed securities
U.S. government-sponsored agency guaranteed $ 17,816 $ 141 $ 2,618 $ 96 $ 20,434 $ 237
Prime — — 1 — 1 —
Non-U.S. residential 2,217 7 825 4 3,042 11
Commercial 291 3 55 1 346 4
Total mortgage-backed securities $ 20,324 $ 151 $ 3,499 $ 101 $ 23,823 $ 252
U.S. Treasury and federal agency securities
U.S. Treasury $ 59,384 $ 505 $ 1,204 $ 10 $ 60,588 $ 515
Agency obligations 6,716 30 196 7 6,912 37
Total U.S. Treasury and federal agency securities $ 66,100 $ 535 $ 1,400 $ 17 $ 67,500 $ 552
State and municipal $ 635 $ 26 $ 4,450 $ 746 $ 5,085 $ 772
Foreign government 35,491 429 4,642 164 40,133 593
Corporate 5,586 132 1,298 45 6,884 177
Asset-backed securities 5,311 58 2,247 34 7,558 92
Other debt securities 27 — — — 27 —
Marketable equity securities AFS 132 3 1 — 133 3
Total securities AFS $133,606 $ 1,334 $17,537 $ 1,107 $151,143 $ 2,441
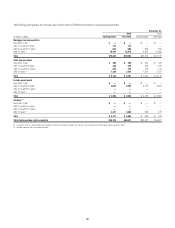
December 31, 2014
Securities AFS
Mortgage-backed securities
U.S. government-sponsored agency guaranteed $ 4,198 $ 30 $ 5,547 $ 129 $ 9,745 $ 159
Prime 5 — 2 — 7 —
Non-U.S. residential 1,276 3 199 4 1,475 7
Commercial 124 1 136 2 260 3
Total mortgage-backed securities $ 5,603 $ 34 $ 5,884 $ 135 $ 11,487 $ 169
U.S. Treasury and federal agency securities
U.S. Treasury $ 36,581 $ 119 $ 1,013 $ 8 $ 37,594 $ 127
Agency obligations 5,698 9 754 4 6,452 13
Total U.S. Treasury and federal agency securities $ 42,279 $ 128 $ 1,767 $ 12 $ 44,046 $ 140
State and municipal $ 386 $ 15 $ 5,802 $ 962 $ 6,188 $ 977
Foreign government 18,495 147 5,984 139 24,479 286
Corporate 3,511 63 1,350 28 4,861 91
Asset-backed securities 3,701 13 3,816 45 7,517 58
Marketable equity securities AFS 51 4 218 40 269 44
Total securities AFS $ 74,026 $ 404 $24,821 $ 1,361 $ 98,847 $ 1,765