Citibank 2015 Annual Report Download - page 26
Download and view the complete annual report
Please find page 26 of the 2015 Citibank annual report below. You can navigate through the pages in the report by either clicking on the pages listed below, or by using the keyword search tool below to find specific information within the annual report.-
 1
1 -
2
-
3
-
4
-
5
-
6
-
7
-
8
-
9
-
10
-
11
-
12
-
13
-
14
-
15
-
 16
16 -
 17
17 -
 18
18 -
 19
19 -
 20
20 -
 21
21 -
 22
22 -
 23
23 -
 24
24 -
 25
25 -
 26
26 -
 27
27 -
 28
28 -
 29
29 -
 30
30 -
 31
31 -
 32
32 -
 33
33 -
 34
34 -
 35
35 -
 36
36 -
37
-
38
-
39
-
40
-
41
-
42
-
43
-
44
-
45
-
46
-
47
-
48
-
49
-
50
-
51
-
52
-
53
-
54
-
55
-
56
-
57
-
58
-
59
-
60
-
61
-
62
-
63
-
64
-
65
-
66
-
67
-
68
-
69
-
70
-
71
-
72
-
73
-
74
-
75
-
76
-
77
-
78
-
79
-
80
-
81
-
82
-
83
-
84
-
85
-
86
-
87
-
88
-
89
-
90
-
91
-
92
-
93
-
94
-
95
-
96
-
97
-
98
-
99
-
100
-
101
-
102
-
103
-
104
-
105
-
106
-
107
-
108
-
109
-
110
-
111
-
112
-
113
-
114
-
115
-
116
-
117
-
118
-
119
-
120
-
121
-
122
-
123
-
124
-
125
-
126
-
127
-
128
-
129
-
130
-
131
-
132
-
133
-
134
-
135
-
136
-
137
-
138
-
139
-
140
-
141
-
142
-
143
-
144
-
145
-
146
-
147
-
148
-
149
-
150
-
151
-
152
-
153
-
154
-
155
-
156
-
157
-
158
-
159
-
160
-
161
-
162
-
163
-
164
-
165
-
166
-
167
-
168
-
169
-
170
-
171
-
172
-
173
-
174
-
175
-
176
-
177
-
178
-
179
-
180
-
181
-
182
-
183
-
184
-
185
-
186
-
187
-
188
-
189
-
190
-
191
-
192
-
193
-
194
-
195
-
196
-
197
-
198
-
199
-
200
-
201
-
202
-
203
-
204
-
205
-
206
-
207
-
208
-
209
-
210
-
211
-
212
-
213
-
214
-
215
-
216
-
217
-
218
-
219
-
220
-
221
-
222
-
223
-
224
-
225
-
226
-
227
-
228
-
229
-
230
-
231
-
232
-
233
-
234
-
235
-
236
-
237
-
238
-
239
-
240
-
241
-
242
-
243
-
244
-
245
-
246
-
247
-
248
-
249
-
250
-
251
-
252
-
253
-
254
-
255
-
256
-
257
-
258
-
259
-
260
-
261
-
262
-
263
-
264
-
265
-
266
-
267
-
268
-
269
-
270
-
271
-
272
-
273
-
274
-
275
-
276
-
277
-
278
-
279
-
280
-
281
-
282
-
283
-
284
-
285
-
286
-
287
-
288
-
289
-
290
-
291
-
292
-
293
-
294
-
295
-
296
-
297
-
298
-
299
-
300
-
301
-
302
-
303
-
304
-
305
-
306
-
307
-
308
-
309
-
310
-
311
-
312
-
313
-
314
-
315
-
316
-
317
-
318
-
319
-
320
-
321
-
322
-
323
-
324
-
325
-
326
-
327
-
328
-
329
-
330
-
331
-
332
 |
 |
8
Citicorp
Citicorp net income increased 50% from the prior year to $16.2 billion.
CVA/DVA, recorded in ICG, was $269 million ($172 million after-tax) in
2015, compared to negative $343 million (negative $211 million after-tax)
in the prior year (for a summary of CVA/DVA by business within ICG, see
“Institutional Clients Group” below). Excluding CVA/DVA in both periods
and the tax item in 2014, Citicorp’s net income was $16.0 billion, up 43%
from the prior year, primarily driven by the lower expenses and net credit
losses, partially offset by lower revenues and the net loan loss reserve builds.
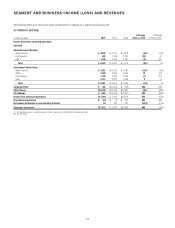
Citicorp revenues decreased 1% from the prior year to $68.5 billion.
Excluding CVA/DVA, Citicorp revenues were $68.2 billion in 2015, down 2%
from the prior year, reflecting largely unchanged revenues in ICG and a
6% decrease in Global Consumer Banking (GCB) revenues. As referenced
above, excluding CVA/DVA and the impact of FX translation, Citicorp’s
revenues grew 3%.
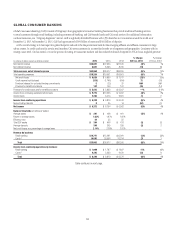
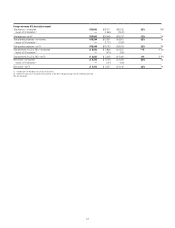
GCB revenues of $33.9 billion decreased 6% versus the prior year.
Excluding the impact of FX translation, GCB revenues decreased 1%, as
decreases in North America GCB and Asia GCB were partially offset by an
increase in Latin America GCB. North America GCB revenues decreased
1% to $19.4 billion, as lower revenues in Citi-branded cards were partially
offset by higher retail banking revenues. Citi-branded cards revenues of $7.8
billion were down 6% versus the prior year, reflecting the continued impact
of lower average loans as well as an increase in acquisition and rewards costs
related to new account acquisitions, particularly during the second half of
2015. Citi retail services revenues of $6.4 billion were largely unchanged
versus the prior year, as the continued impact of lower fuel prices and higher
contractual partner payments was offset by modest growth in average loans.
Retail banking revenues increased 6% from the prior year to $5.2 billion,
reflecting continued loan and deposit growth and improved deposit spreads.
North America GCB average deposits of $172 billion increased 1% year-over-
year and average retail loans of $50 billion grew 7%. Average card loans of
$107 billion decreased 2%, while purchase sales of $263 billion increased 4%
versus the prior year. For additional information on the results of operations
of North America GCB for 2015, see “Global Consumer Banking—
North America GCB” below.
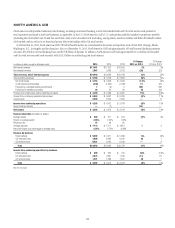
International GCB revenues (consisting of EMEA GCB, Latin America
GCB and Asia GCB) decreased 12% versus the prior year to $14.4 billion.
Excluding the impact of FX translation, international GCB revenues were
unchanged versus the prior year. Latin America GCB revenues increased 3%
versus the prior year, as increases in loan and deposit balances as well as the
impact of business divestitures were partially offset by the continued impact
of spread compression in cards. Asia GCB revenues declined 3% versus the
prior year, reflecting lower investment sales revenues as well as continued
high payment rates and the ongoing impact of regulatory changes in cards,
partially offset by growth in lending, deposit and insurance products. For
additional information on the results of operations of Latin America GCB
and Asia GCB (which includes the results of operations of EMEA GCB
for reporting purposes) for 2015, including the impact of FX translation,
see “Global Consumer Banking” below. Year-over-year, international
GCB average deposits of $129 billion increased 5%, average retail loans
of $99 billion increased 3%, investment sales of $78 billion decreased 8%,
average card loans of $26 billion increased 2% and card purchase sales of
$101 billion increased 6%, all excluding the impact of FX translation.
ICG revenues were $33.7 billion in 2015, up 2% from the prior year.
Excluding CVA/DVA, ICG revenues were largely unchanged from the prior year
at $33.5 billion.
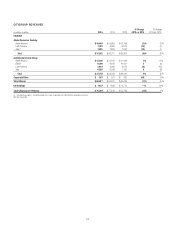
Banking revenues of $16.9 billion, excluding CVA/DVA and the impact of
mark-to-market gains on hedges related to accrual loans within corporate
lending (see below), were largely unchanged compared to the prior year,
as lower equity underwriting activity within investment banking as well
as the impact of FX translation was offset by higher advisory revenues and
continued growth in the private bank. Investment banking revenues of
$4.5 billion decreased 3% versus the prior year. Advisory revenues increased
16% to $1.1 billion with sustained wallet share gains for the year. Debt
underwriting revenues increased 1% to $2.5 billion, driven by wallet share
gains in investment grade debt and strong performance in investment
grade loans in the second half of 2015, while equity underwriting revenues
decreased 28% to $902 million, largely reflecting lower industry-wide
underwriting activity during the year.
Private bank revenues, excluding CVA/DVA, increased 8% to $2.9 billion
from the prior year, driven by higher loan and deposit balances as well as
growth in managed investments revenue. Corporate lending revenues rose 8%
to $2.0 billion, including $323 million of mark-to-market gains on hedges
related to accrual loans compared to a $116 million gain in the prior year.
Excluding the impact of FX translation and the mark-to-market impact
of loan hedges, corporate lending revenues increased 3% versus the prior
year, as growth in average loans was partially offset by the impact of lower
spreads. Treasury and trade solutions revenues of $7.8 billion were relatively
unchanged versus the prior year. Excluding the impact of FX translation,
treasury and trade solutions revenues increased 6%, as continued growth in
deposit balances and spreads was partially offset by lower trade revenues.