Citibank 2015 Annual Report Download - page 92
Download and view the complete annual report
Please find page 92 of the 2015 Citibank annual report below. You can navigate through the pages in the report by either clicking on the pages listed below, or by using the keyword search tool below to find specific information within the annual report.-
 1
1 -
2
-
3
-
4
-
5
-
6
-
7
-
8
-
9
-
10
-
11
-
12
-
13
-
14
-
15
-
16
-
17
-
18
-
19
-
20
-
21
-
22
-
23
-
24
-
25
-
26
-
27
-
28
-
29
-
30
-
31
-
32
-
33
-
34
-
35
-
36
-
37
-
38
-
39
-
40
-
41
-
42
-
43
-
44
-
45
-
46
-
47
-
48
-
49
-
50
-
51
-
52
-
53
-
54
-
55
-
56
-
57
-
58
-
59
-
60
-
61
-
62
-
63
-
64
-
65
-
66
-
67
-
68
-
69
-
70
-
71
-
72
-
73
-
74
-
75
-
76
-
77
-
78
-
79
-
80
-
81
-
 82
82 -
 83
83 -
 84
84 -
 85
85 -
 86
86 -
 87
87 -
 88
88 -
 89
89 -
 90
90 -
 91
91 -
 92
92 -
 93
93 -
 94
94 -
 95
95 -
 96
96 -
 97
97 -
 98
98 -
 99
99 -
 100
100 -
 101
101 -
 102
102 -
103
-
104
-
105
-
106
-
107
-
108
-
109
-
110
-
111
-
112
-
113
-
114
-
115
-
116
-
117
-
118
-
119
-
120
-
121
-
122
-
123
-
124
-
125
-
126
-
127
-
128
-
129
-
130
-
131
-
132
-
133
-
134
-
135
-
136
-
137
-
138
-
139
-
140
-
141
-
142
-
143
-
144
-
145
-
146
-
147
-
148
-
149
-
150
-
151
-
152
-
153
-
154
-
155
-
156
-
157
-
158
-
159
-
160
-
161
-
162
-
163
-
164
-
165
-
166
-
167
-
168
-
169
-
170
-
171
-
172
-
173
-
174
-
175
-
176
-
177
-
178
-
179
-
180
-
181
-
182
-
183
-
184
-
185
-
186
-
187
-
188
-
189
-
190
-
191
-
192
-
193
-
194
-
195
-
196
-
197
-
198
-
199
-
200
-
201
-
202
-
203
-
204
-
205
-
206
-
207
-
208
-
209
-
210
-
211
-
212
-
213
-
214
-
215
-
216
-
217
-
218
-
219
-
220
-
221
-
222
-
223
-
224
-
225
-
226
-
227
-
228
-
229
-
230
-
231
-
232
-
233
-
234
-
235
-
236
-
237
-
238
-
239
-
240
-
241
-
242
-
243
-
244
-
245
-
246
-
247
-
248
-
249
-
250
-
251
-
252
-
253
-
254
-
255
-
256
-
257
-
258
-
259
-
260
-
261
-
262
-
263
-
264
-
265
-
266
-
267
-
268
-
269
-
270
-
271
-
272
-
273
-
274
-
275
-
276
-
277
-
278
-
279
-
280
-
281
-
282
-
283
-
284
-
285
-
286
-
287
-
288
-
289
-
290
-
291
-
292
-
293
-
294
-
295
-
296
-
297
-
298
-
299
-
300
-
301
-
302
-
303
-
304
-
305
-
306
-
307
-
308
-
309
-
310
-
311
-
312
-
313
-
314
-
315
-
316
-
317
-
318
-
319
-
320
-
321
-
322
-
323
-
324
-
325
-
326
-
327
-
328
-
329
-
330
-
331
-
332
 |
 |

74
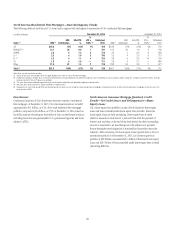
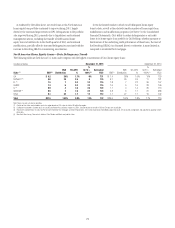
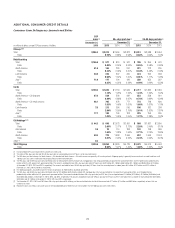
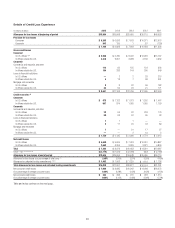
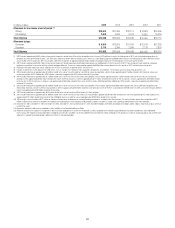
ADDITIONAL CONSUMER CREDIT DETAILS
Consumer Loan Delinquency Amounts and Ratios
EOP
loans (1) 90+ days past due (2) 30–89 days past due (2)
December 31, December 31, December 31,
In millions of dollars, except EOP loan amounts in billions 2015 2015 2014 2013 2015 2014 2013
Citicorp (3)(4)
Total $285.3 $2,213 $ 2,566 $ 2,872 $ 2,512 $ 2,688 $ 3,054
Ratio 0.78% 0.88% 0.98% 0.88% 0.93% 1.04%
Retail banking
Total $146.8 $ 577 $ 816 $ 927 $ 795 $ 854 $ 970
Ratio 0.40% 0.55% 0.63% 0.55% 0.58% 0.66%
North America 51.8 165 225 257 221 212 205
Ratio 0.33% 0.49% 0.60% 0.44% 0.46% 0.48%
Latin America 24.0 235 397 460 224 290 368
Ratio 0.98% 1.52% 1.60% 0.93% 1.11% 1.28%
Asia (5) 71.0 177 194 210 350 352 397
Ratio 0.25% 0.25% 0.28% 0.49% 0.46% 0.53%
Cards
Total $138.5 $1,636 $ 1,750 $ 1,945 $ 1,717 $ 1,834 $ 2,084
Ratio 1.18% 1.23% 1.33% 1.24% 1.29% 1.42%
North America—Citi-branded 67.2 538 593 681 523 568 661
Ratio 0.80% 0.88% 0.97% 0.78% 0.84% 0.94%
North America—Citi retail services 46.1 705 678 771 773 748 830
Ratio 1.53% 1.46% 1.67% 1.68% 1.61% 1.79%
Latin America 7.5 213 284 290 196 262 298
Ratio 2.84% 3.05% 2.79% 2.61% 2.82% 2.87%
Asia (5) 17.7 180 195 203 225 256 295
Ratio 1.02% 1.05% 1.05% 1.27% 1.38% 1.52%
Citi Holdings (6)(7)
Total $ 44.3 $ 840 $ 2,073 $ 2,857 $ 960 $ 1,831 $ 2,890
Ratio 2.00% 2.77% 3.12% 2.28% 2.45% 3.15%
International 3.8 70 110 263 103 168 366
Ratio 1.84% 1.38% 1.93% 2.71% 2.10% 2.69%
North America 40.5 770 1,963 2,594 857 1,663 2,524
Ratio 2.01% 2.94% 3.33% 2.24% 2.49% 3.24%
Other (8) 0.2
Total Citigroup $ 329.8 $ 3,053 $ 4,639 $ 5,729 $ 3,472 $ 4,519 $ 5,944
Ratio 0.94% 1.27% 1.49% 1.06% 1.24% 1.54%
(1) End-of-period (EOP) loans include interest and fees on credit cards.
(2) The ratios of 90+ days past due and 30–89 days past due are calculated based on EOP loans, net of unearned income.
(3) The 90+ days past due balances for North America—Citi-branded and North America—Citi retail services are generally still accruing interest. Citigroup’s policy is generally to accrue interest on credit card loans until
180 days past due, unless notification of bankruptcy filing has been received earlier.
(4) The 90+ days and 30–89 days past due and related ratios for Citicorp North America exclude U.S. mortgage loans that are guaranteed by U.S. government-sponsored entities since the potential loss predominantly
resides within the U.S. government-sponsored entities. The amounts excluded for loans 90+ days past due and (EOP loans) were $491 million ($1.1 billion), $562 million ($1.1 billion) and $690 million ($1.2 billion)
at December 31, 2015, 2014 and 2013, respectively. The amounts excluded for loans 30–89 days past due (EOP loans have the same adjustment as above) were $87 million, $122 million and $141 million at
December 31, 2015, 2014 and 2013, respectively.
(5) For reporting purposes, Asia GCB includes the results of operations of EMEA GCB for all periods presented.
(6) The 90+ days and 30–89 days past due and related ratios for Citi Holdings North America exclude U.S. mortgage loans that are guaranteed by U.S. government-sponsored entities since the potential loss
predominantly resides within the U.S. government-sponsored entities. The amounts excluded for loans 90+ days past due (and EOP loans) for each period were $1.5 billion ($2.2 billion), $2.2 billion ($4.0 billion) and
$3.3 billion ($6.4 billion) at December 31, 2015, 2014 and 2013, respectively. The amounts excluded for loans 30–89 days past due (EOP loans have the same adjustment as above) for each period were $0.2 billion,
$0.5 billion and $1.1 billion at December 31, 2015, 2014 and 2013, respectively.
(7) The December 31, 2015, 2014 and 2013 loans 90+ days past due and 30–89 days past due and related ratios for North America exclude $11 million, $14 million and $0.9 billion, respectively, of loans that are
carried at fair value.
(8) Represents loans classified as Consumer loans on the Consolidated Balance Sheet that are not included in the Citi Holdings consumer credit metrics.