Citibank 2015 Annual Report Download - page 32
Download and view the complete annual report
Please find page 32 of the 2015 Citibank annual report below. You can navigate through the pages in the report by either clicking on the pages listed below, or by using the keyword search tool below to find specific information within the annual report.-
 1
1 -
2
-
3
-
4
-
5
-
6
-
7
-
8
-
9
-
10
-
11
-
12
-
13
-
14
-
15
-
16
-
17
-
18
-
19
-
20
-
21
-
 22
22 -
 23
23 -
 24
24 -
 25
25 -
 26
26 -
 27
27 -
 28
28 -
 29
29 -
 30
30 -
 31
31 -
 32
32 -
 33
33 -
 34
34 -
 35
35 -
 36
36 -
 37
37 -
 38
38 -
 39
39 -
 40
40 -
 41
41 -
 42
42 -
43
-
44
-
45
-
46
-
47
-
48
-
49
-
50
-
51
-
52
-
53
-
54
-
55
-
56
-
57
-
58
-
59
-
60
-
61
-
62
-
63
-
64
-
65
-
66
-
67
-
68
-
69
-
70
-
71
-
72
-
73
-
74
-
75
-
76
-
77
-
78
-
79
-
80
-
81
-
82
-
83
-
84
-
85
-
86
-
87
-
88
-
89
-
90
-
91
-
92
-
93
-
94
-
95
-
96
-
97
-
98
-
99
-
100
-
101
-
102
-
103
-
104
-
105
-
106
-
107
-
108
-
109
-
110
-
111
-
112
-
113
-
114
-
115
-
116
-
117
-
118
-
119
-
120
-
121
-
122
-
123
-
124
-
125
-
126
-
127
-
128
-
129
-
130
-
131
-
132
-
133
-
134
-
135
-
136
-
137
-
138
-
139
-
140
-
141
-
142
-
143
-
144
-
145
-
146
-
147
-
148
-
149
-
150
-
151
-
152
-
153
-
154
-
155
-
156
-
157
-
158
-
159
-
160
-
161
-
162
-
163
-
164
-
165
-
166
-
167
-
168
-
169
-
170
-
171
-
172
-
173
-
174
-
175
-
176
-
177
-
178
-
179
-
180
-
181
-
182
-
183
-
184
-
185
-
186
-
187
-
188
-
189
-
190
-
191
-
192
-
193
-
194
-
195
-
196
-
197
-
198
-
199
-
200
-
201
-
202
-
203
-
204
-
205
-
206
-
207
-
208
-
209
-
210
-
211
-
212
-
213
-
214
-
215
-
216
-
217
-
218
-
219
-
220
-
221
-
222
-
223
-
224
-
225
-
226
-
227
-
228
-
229
-
230
-
231
-
232
-
233
-
234
-
235
-
236
-
237
-
238
-
239
-
240
-
241
-
242
-
243
-
244
-
245
-
246
-
247
-
248
-
249
-
250
-
251
-
252
-
253
-
254
-
255
-
256
-
257
-
258
-
259
-
260
-
261
-
262
-
263
-
264
-
265
-
266
-
267
-
268
-
269
-
270
-
271
-
272
-
273
-
274
-
275
-
276
-
277
-
278
-
279
-
280
-
281
-
282
-
283
-
284
-
285
-
286
-
287
-
288
-
289
-
290
-
291
-
292
-
293
-
294
-
295
-
296
-
297
-
298
-
299
-
300
-
301
-
302
-
303
-
304
-
305
-
306
-
307
-
308
-
309
-
310
-
311
-
312
-
313
-
314
-
315
-
316
-
317
-
318
-
319
-
320
-
321
-
322
-
323
-
324
-
325
-
326
-
327
-
328
-
329
-
330
-
331
-
332
 |
 |
14
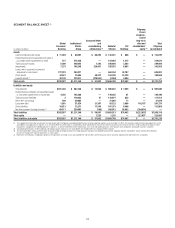
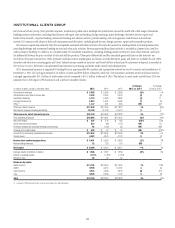
SEGMENT BALANCE SHEET (1)
In millions of dollars
Global
Consumer
Banking
Institutional
Clients
Group
Corporate/Other
and
consolidating
eliminations (2)
Subtotal
Citicorp
Citi
Holdings
Citigroup
Parent
company-
issued
long-term
debt and
stockholders’
equity (3)
Total
Citigroup
consolidated
Assets
Cash and deposits with banks $ 11,389 $ 60,557 $ 60,285 $ 132,231 $ 866 $ — $ 133,097
Federal funds sold and securities borrowed or
purchased under agreements to resell 127 218,336 — 218,463 1,212 — 219,675
Trading account assets 5,290 240,022 1,382 246,694 3,262 — 249,956
Investments 7,273 108,248 220,451 335,972 6,983 — 342,955
Loans, net of unearned income and
allowance for loan losses 277,323 284,871 — 562,194 42,797 — 604,991
Other assets 44,047 75,504 45,237 164,788 15,748 — 180,536
Liquidity assets (4) 48,148 223,811 (275,553) (3,594) 3,594 — —
Total assets $393,597 $1,211,349 $ 51,802 $1,656,748 $74,462 $ — $1,731,210
Liabilities and equity
Total deposits $301,438 $ 587,336 $ 12,058 $ 900,832 $ 7,055 $ — $ 907,887
Federal funds purchased and securities loaned
or sold under agreements to repurchase 4,235 142,200 — 146,435 61 — 146,496
Trading account liabilities 3 116,633 41 116,677 835 — 117,512
Short-term borrowings 100 20,962 — 21,062 17 — 21,079
Long-term debt 1,891 31,924 21,307 55,122 3,996 142,157 201,275
Other liabilities 16,813 73,211 17,349 107,373 6,496 — 113,869
Net inter-segment funding (lending) (3) 69,117 239,083 (188) 308,012 56,002 (364,014) —
Total liabilities $393,597 $1,211,349 $ 50,567 $1,655,513 $74,462 $(221,857) $1,508,118
Total equity — — 1,235 1,235 — 221,857 223,092
Total liabilities and equity $393,597 $1,211,349 $ 51,802 $1,656,748 $74,462 $ — $1,731,210
(1) The supplemental information presented in the table above reflects Citigroup’s consolidated GAAP balance sheet by reporting segment as of December 31, 2015. The respective segment information depicts the assets
and liabilities managed by each segment as of such date. While this presentation is not defined by GAAP, Citi believes that these non-GAAP financial measures enhance investors’ understanding of the balance sheet
components managed by the underlying business segments, as well as the beneficial inter-relationships of the asset and liability dynamics of the balance sheet components among Citi’s business segments.
(2) Consolidating eliminations for total Citigroup and Citigroup parent company assets and liabilities are recorded within the Corporate/Other segment.
(3) The total stockholders’ equity and the majority of long-term debt of Citigroup reside in the Citigroup parent company Consolidated Balance Sheet. Citigroup allocates stockholders’ equity and long-term debt to its
businesses through inter-segment allocations as shown above.
(4) Represents the attribution of Citigroup’s liquidity assets (primarily consisting of cash and available-for-sale securities) to the various businesses based on Liquidity Coverage Ratio (LCR) assumptions.