Citibank 2015 Annual Report Download - page 218
Download and view the complete annual report
Please find page 218 of the 2015 Citibank annual report below. You can navigate through the pages in the report by either clicking on the pages listed below, or by using the keyword search tool below to find specific information within the annual report.-
 1
1 -
2
-
3
-
4
-
5
-
6
-
7
-
8
-
9
-
10
-
11
-
12
-
13
-
14
-
15
-
16
-
17
-
18
-
19
-
20
-
21
-
22
-
23
-
24
-
25
-
26
-
27
-
28
-
29
-
30
-
31
-
32
-
33
-
34
-
35
-
36
-
37
-
38
-
39
-
40
-
41
-
42
-
43
-
44
-
45
-
46
-
47
-
48
-
49
-
50
-
51
-
52
-
53
-
54
-
55
-
56
-
57
-
58
-
59
-
60
-
61
-
62
-
63
-
64
-
65
-
66
-
67
-
68
-
69
-
70
-
71
-
72
-
73
-
74
-
75
-
76
-
77
-
78
-
79
-
80
-
81
-
82
-
83
-
84
-
85
-
86
-
87
-
88
-
89
-
90
-
91
-
92
-
93
-
94
-
95
-
96
-
97
-
98
-
99
-
100
-
101
-
102
-
103
-
104
-
105
-
106
-
107
-
108
-
109
-
110
-
111
-
112
-
113
-
114
-
115
-
116
-
117
-
118
-
119
-
120
-
121
-
122
-
123
-
124
-
125
-
126
-
127
-
128
-
129
-
130
-
131
-
132
-
133
-
134
-
135
-
136
-
137
-
138
-
139
-
140
-
141
-
142
-
143
-
144
-
145
-
146
-
147
-
148
-
149
-
150
-
151
-
152
-
153
-
154
-
155
-
156
-
157
-
158
-
159
-
160
-
161
-
162
-
163
-
164
-
165
-
166
-
167
-
168
-
169
-
170
-
171
-
172
-
173
-
174
-
175
-
176
-
177
-
178
-
179
-
180
-
181
-
182
-
183
-
184
-
185
-
186
-
187
-
188
-
189
-
190
-
191
-
192
-
193
-
194
-
195
-
196
-
197
-
198
-
199
-
200
-
201
-
202
-
203
-
204
-
205
-
206
-
207
-
 208
208 -
 209
209 -
 210
210 -
 211
211 -
 212
212 -
 213
213 -
 214
214 -
 215
215 -
 216
216 -
 217
217 -
 218
218 -
 219
219 -
 220
220 -
 221
221 -
 222
222 -
 223
223 -
 224
224 -
 225
225 -
 226
226 -
 227
227 -
 228
228 -
229
-
230
-
231
-
232
-
233
-
234
-
235
-
236
-
237
-
238
-
239
-
240
-
241
-
242
-
243
-
244
-
245
-
246
-
247
-
248
-
249
-
250
-
251
-
252
-
253
-
254
-
255
-
256
-
257
-
258
-
259
-
260
-
261
-
262
-
263
-
264
-
265
-
266
-
267
-
268
-
269
-
270
-
271
-
272
-
273
-
274
-
275
-
276
-
277
-
278
-
279
-
280
-
281
-
282
-
283
-
284
-
285
-
286
-
287
-
288
-
289
-
290
-
291
-
292
-
293
-
294
-
295
-
296
-
297
-
298
-
299
-
300
-
301
-
302
-
303
-
304
-
305
-
306
-
307
-
308
-
309
-
310
-
311
-
312
-
313
-
314
-
315
-
316
-
317
-
318
-
319
-
320
-
321
-
322
-
323
-
324
-
325
-
326
-
327
-
328
-
329
-
330
-
331
-
332
 |
 |

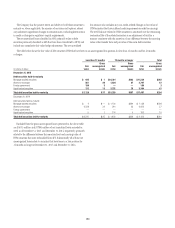
200
FICO score distribution in U.S. portfolio (1)(2) December 31, 2014
In millions of dollars
Less than
620
≥ 620 but less
than 660
Equal to or
greater
than 660
Residential first mortgages $ 8,911 $ 5,463 $ 45,783
Home equity loans 3,257 2,456 20,957
Credit cards 7,647 10,296 92,877
Installment and other 4,015 2,520 5,150
Total $23,830 $20,735 $164,767
(1) Excludes loans guaranteed by U.S. government entities, loans subject to LTSCs with U.S. government-
sponsored entities and loans recorded at fair value.
(2) Excludes balances where FICO was not available. Such amounts are not material.
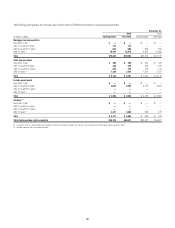
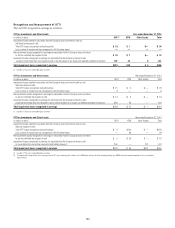
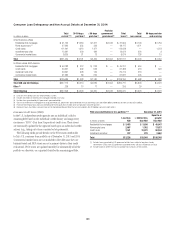
Loan to Value (LTV) Ratios
LTV ratios (loan balance divided by appraised value) are calculated at
origination and updated by applying market price data.
The following tables provide details on the LTV ratios attributable to Citi’s
U.S. consumer mortgage portfolios. LTV ratios are updated monthly using the
most recent Core Logic Home Price Index data available for substantially all
of the portfolio applied at the Metropolitan Statistical Area level, if available,
or the state level if not. The remainder of the portfolio is updated in a similar
manner using the Federal Housing Finance Agency indices.
LTV distribution in U.S. portfolio (1)(2) December 31, 2015
In millions of dollars
Less than or
equal to 80%
> 80% but less
than or equal to
100%
Greater
than
100%
Residential first mortgages $46,559 $4,478 $ 626
Home equity loans 13,904 5,147 2,527
Total $60,463 $9,625 $3,153
(1) Excludes loans guaranteed by U.S. government entities, loans subject to LTSCs with U.S. government-
sponsored entities and loans recorded at fair value.
(2) Excludes balances where LTV was not available. Such amounts are not material.
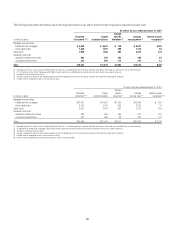
LTV distribution in U.S. portfolio (1)(2) December 31, 2014
In millions of dollars
Less than or
equal to 80%
> 80% but less
than or equal to
100%
Greater
than
100%
Residential first mortgages $48,163 $ 9,480 $2,670
Home equity loans 14,638 7,267 4,641
Total $62,801 $16,747 $7,311
(1) Excludes loans guaranteed by U.S. government entities, loans subject to LTSCs with U.S. government-
sponsored entities and loans recorded at fair value.
(2) Excludes balances where LTV was not available. Such amounts are not material.
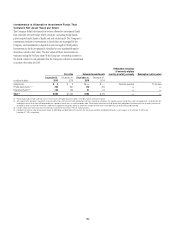
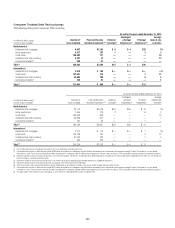
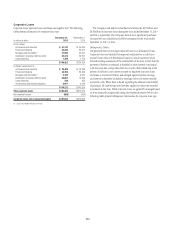
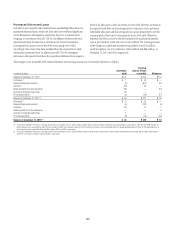
Impaired Consumer Loans
Impaired loans are those loans where Citigroup believes it is probable all
amounts due according to the original contractual terms of the loan will
not be collected. Impaired consumer loans include non-accrual commercial
market loans, as well as smaller-balance homogeneous loans whose terms
have been modified due to the borrower’s financial difficulties and where
Citigroup has granted a concession to the borrower. These modifications
may include interest rate reductions and/or principal forgiveness. Impaired
consumer loans exclude smaller-balance homogeneous loans that have not
been modified and are carried on a non-accrual basis.