Citibank 2015 Annual Report Download - page 86
Download and view the complete annual report
Please find page 86 of the 2015 Citibank annual report below. You can navigate through the pages in the report by either clicking on the pages listed below, or by using the keyword search tool below to find specific information within the annual report.-
 1
1 -
2
-
3
-
4
-
5
-
6
-
7
-
8
-
9
-
10
-
11
-
12
-
13
-
14
-
15
-
16
-
17
-
18
-
19
-
20
-
21
-
22
-
23
-
24
-
25
-
26
-
27
-
28
-
29
-
30
-
31
-
32
-
33
-
34
-
35
-
36
-
37
-
38
-
39
-
40
-
41
-
42
-
43
-
44
-
45
-
46
-
47
-
48
-
49
-
50
-
51
-
52
-
53
-
54
-
55
-
56
-
57
-
58
-
59
-
60
-
61
-
62
-
63
-
64
-
65
-
66
-
67
-
68
-
69
-
70
-
71
-
72
-
73
-
74
-
75
-
 76
76 -
 77
77 -
 78
78 -
 79
79 -
 80
80 -
 81
81 -
 82
82 -
 83
83 -
 84
84 -
 85
85 -
 86
86 -
 87
87 -
 88
88 -
 89
89 -
 90
90 -
 91
91 -
 92
92 -
 93
93 -
 94
94 -
 95
95 -
 96
96 -
97
-
98
-
99
-
100
-
101
-
102
-
103
-
104
-
105
-
106
-
107
-
108
-
109
-
110
-
111
-
112
-
113
-
114
-
115
-
116
-
117
-
118
-
119
-
120
-
121
-
122
-
123
-
124
-
125
-
126
-
127
-
128
-
129
-
130
-
131
-
132
-
133
-
134
-
135
-
136
-
137
-
138
-
139
-
140
-
141
-
142
-
143
-
144
-
145
-
146
-
147
-
148
-
149
-
150
-
151
-
152
-
153
-
154
-
155
-
156
-
157
-
158
-
159
-
160
-
161
-
162
-
163
-
164
-
165
-
166
-
167
-
168
-
169
-
170
-
171
-
172
-
173
-
174
-
175
-
176
-
177
-
178
-
179
-
180
-
181
-
182
-
183
-
184
-
185
-
186
-
187
-
188
-
189
-
190
-
191
-
192
-
193
-
194
-
195
-
196
-
197
-
198
-
199
-
200
-
201
-
202
-
203
-
204
-
205
-
206
-
207
-
208
-
209
-
210
-
211
-
212
-
213
-
214
-
215
-
216
-
217
-
218
-
219
-
220
-
221
-
222
-
223
-
224
-
225
-
226
-
227
-
228
-
229
-
230
-
231
-
232
-
233
-
234
-
235
-
236
-
237
-
238
-
239
-
240
-
241
-
242
-
243
-
244
-
245
-
246
-
247
-
248
-
249
-
250
-
251
-
252
-
253
-
254
-
255
-
256
-
257
-
258
-
259
-
260
-
261
-
262
-
263
-
264
-
265
-
266
-
267
-
268
-
269
-
270
-
271
-
272
-
273
-
274
-
275
-
276
-
277
-
278
-
279
-
280
-
281
-
282
-
283
-
284
-
285
-
286
-
287
-
288
-
289
-
290
-
291
-
292
-
293
-
294
-
295
-
296
-
297
-
298
-
299
-
300
-
301
-
302
-
303
-
304
-
305
-
306
-
307
-
308
-
309
-
310
-
311
-
312
-
313
-
314
-
315
-
316
-
317
-
318
-
319
-
320
-
321
-
322
-
323
-
324
-
325
-
326
-
327
-
328
-
329
-
330
-
331
-
332
 |
 |
68
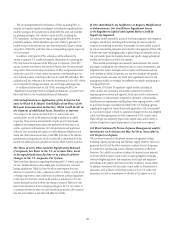
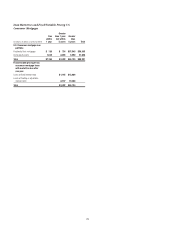
As of December 31, 2015, Citi’s North America residential first mortgage
portfolio contained approximately $2.4 billion of adjustable rate mortgages
that are currently required to make a payment consisting of only accrued
interest for the payment period, or an interest-only payment, compared to
$3.8 billion at December 31, 2014. This decline resulted primarily from
repayments and conversions to amortizing loans. Residential first mortgages
with this payment feature are primarily to high-credit-quality borrowers
who have on average significantly higher origination and refreshed FICO
scores than other loans in the residential first mortgage portfolio, and
have exhibited significantly lower 30+ delinquency rates as compared
with residential first mortgages without this payment feature. As such, Citi
does not believe the residential mortgage loans with this payment feature
represent substantially higher risk in the portfolio.
Citi does not offer option-adjustable rate mortgages/negative-amortizing
mortgage products to its customers. As a result, option-adjustable rate
mortgages/negative-amortizing mortgages represent an insignificant portion
of total balances, since they were acquired only incidentally as part of prior
portfolio and business purchases.
For additional information on Citi’s North America consumer mortgage
portfolio, see Note 15 to the Consolidated Financial Statements.
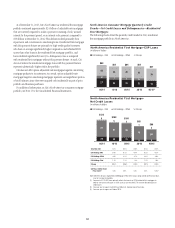
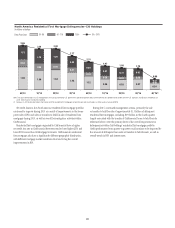
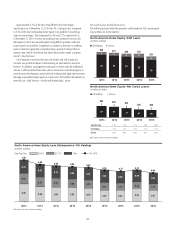
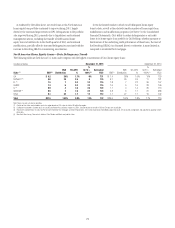
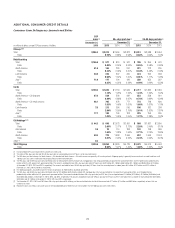
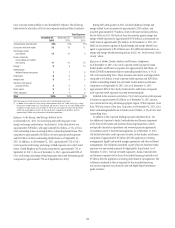
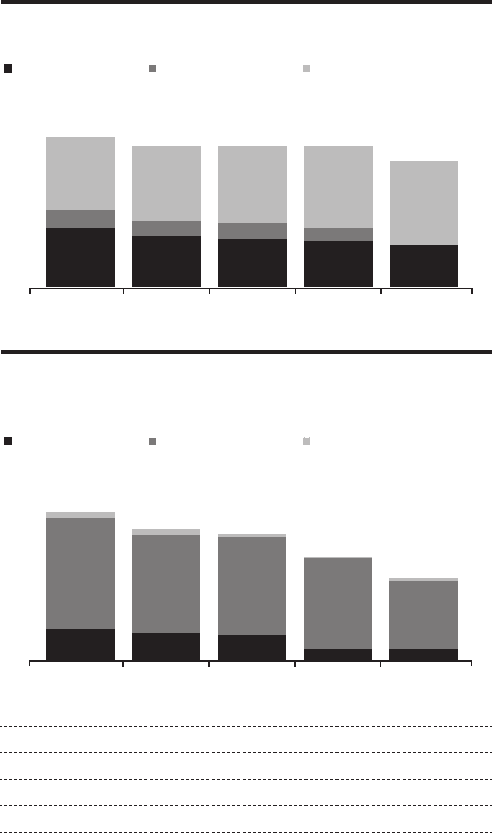
North America Consumer Mortgage Quarterly Credit
Trends—Net Credit Losses and Delinquencies—Residential
First Mortgages
The following charts detail the quarterly credit trends for Citi’s residential
first mortgage portfolio in North America.
4Q’15(1)
3Q’152Q’151Q’154Q’14
27
8
33
23
7
34
22
7
35
21
6
37
19
38
North America Residential First Mortgage—EOP Loans
In billions of dollars
Citi Holdings - CMI Citi Holdings - CFNA Citicorp
$68 $64 $64 $57
$64
4Q'153Q'152Q'151Q'154Q'14
26
91
5
22
81
5
21
80
3
9
75
1
9
56
3
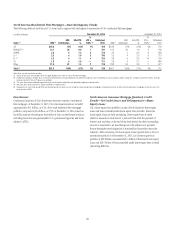
North America Residential First Mortgage—
Net Credit Losses
In millions of dollars
Citi Holdings - CMI Citi Holdings - CFNA Citicorp
$122
$108 $104
$68
$85
Total NCL Rate 0.7% 0.6% 0.6% 0.5% 0.4%
Citi Holdings CMI 0.4% 0.3% 0.4% 0.2% 0.2%
Citi Holdings CFNA 4.6% 4.5% 4.7% 4.6% 4.0%
Citi Holdings Total 1.3% 1.3% 1.4% 1.2% 1.0%
Citicorp 0.05% 0.06% 0.03% 0.01% 0.03%
S&P/Case Shiller Home
Price Index(2) 4.4% 4.9% 4.8% 5.4% 5.6%(3)
Note: CMI refers to loans originated by CitiMortgage. CFNA refers to loans originated by CitiFinancial. Totals
may not sum due to rounding.
(1) Decrease in 4Q’15 EOP loans primarily reflects the transfer of CFNA residential first mortgages to
held-for-sale and classification as Other assets at year-end 2015. This transfer did not impact net
credit losses.
(2) Year-over-year change in the S&P/Case-Shiller U.S. National Home Price Index.
(3) Year-over-year change as of October 2015.