Citibank 2015 Annual Report Download - page 129
Download and view the complete annual report
Please find page 129 of the 2015 Citibank annual report below. You can navigate through the pages in the report by either clicking on the pages listed below, or by using the keyword search tool below to find specific information within the annual report.-
 1
1 -
2
-
3
-
4
-
5
-
6
-
7
-
8
-
9
-
10
-
11
-
12
-
13
-
14
-
15
-
16
-
17
-
18
-
19
-
20
-
21
-
22
-
23
-
24
-
25
-
26
-
27
-
28
-
29
-
30
-
31
-
32
-
33
-
34
-
35
-
36
-
37
-
38
-
39
-
40
-
41
-
42
-
43
-
44
-
45
-
46
-
47
-
48
-
49
-
50
-
51
-
52
-
53
-
54
-
55
-
56
-
57
-
58
-
59
-
60
-
61
-
62
-
63
-
64
-
65
-
66
-
67
-
68
-
69
-
70
-
71
-
72
-
73
-
74
-
75
-
76
-
77
-
78
-
79
-
80
-
81
-
82
-
83
-
84
-
85
-
86
-
87
-
88
-
89
-
90
-
91
-
92
-
93
-
94
-
95
-
96
-
97
-
98
-
99
-
100
-
101
-
102
-
103
-
104
-
105
-
106
-
107
-
108
-
109
-
110
-
111
-
112
-
113
-
114
-
115
-
116
-
117
-
118
-
 119
119 -
 120
120 -
 121
121 -
 122
122 -
 123
123 -
 124
124 -
 125
125 -
 126
126 -
 127
127 -
 128
128 -
 129
129 -
 130
130 -
 131
131 -
 132
132 -
 133
133 -
 134
134 -
 135
135 -
 136
136 -
 137
137 -
 138
138 -
 139
139 -
140
-
141
-
142
-
143
-
144
-
145
-
146
-
147
-
148
-
149
-
150
-
151
-
152
-
153
-
154
-
155
-
156
-
157
-
158
-
159
-
160
-
161
-
162
-
163
-
164
-
165
-
166
-
167
-
168
-
169
-
170
-
171
-
172
-
173
-
174
-
175
-
176
-
177
-
178
-
179
-
180
-
181
-
182
-
183
-
184
-
185
-
186
-
187
-
188
-
189
-
190
-
191
-
192
-
193
-
194
-
195
-
196
-
197
-
198
-
199
-
200
-
201
-
202
-
203
-
204
-
205
-
206
-
207
-
208
-
209
-
210
-
211
-
212
-
213
-
214
-
215
-
216
-
217
-
218
-
219
-
220
-
221
-
222
-
223
-
224
-
225
-
226
-
227
-
228
-
229
-
230
-
231
-
232
-
233
-
234
-
235
-
236
-
237
-
238
-
239
-
240
-
241
-
242
-
243
-
244
-
245
-
246
-
247
-
248
-
249
-
250
-
251
-
252
-
253
-
254
-
255
-
256
-
257
-
258
-
259
-
260
-
261
-
262
-
263
-
264
-
265
-
266
-
267
-
268
-
269
-
270
-
271
-
272
-
273
-
274
-
275
-
276
-
277
-
278
-
279
-
280
-
281
-
282
-
283
-
284
-
285
-
286
-
287
-
288
-
289
-
290
-
291
-
292
-
293
-
294
-
295
-
296
-
297
-
298
-
299
-
300
-
301
-
302
-
303
-
304
-
305
-
306
-
307
-
308
-
309
-
310
-
311
-
312
-
313
-
314
-
315
-
316
-
317
-
318
-
319
-
320
-
321
-
322
-
323
-
324
-
325
-
326
-
327
-
328
-
329
-
330
-
331
-
332
 |
 |

111
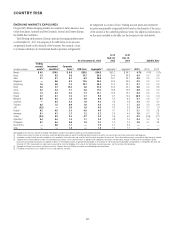
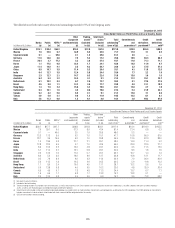
EMERGING MARKETS EXPOSURES
Citi generally defines emerging markets as countries in Latin America, Asia
(other than Japan, Australia and New Zealand), Central and Eastern Europe,
the Middle East and Africa.
The following table presents Citicorp’s principal emerging markets assets
as of December 31, 2015. For purposes of the table below, loan amounts
are generally based on the domicile of the borrower. For example, a loan
to a Chinese subsidiary of a Switzerland-based corporation will generally
be categorized as a loan in China. Trading account assets and investment
securities are generally categorized below based on the domicile of the issuer
of the security or the underlying reference entity (for additional information
on the assets included in the table, see the footnotes to the table below).
As of December 31, 2015
As of
Sept. 30,
2015
As of
Dec. 31,
2014 GCB NCL Rate
In billions of dollars
Trading
account
assets (1)
Investment
securities (2)
Corporate
loans (3) GCB loans Aggregate (4) Aggregate (4) Aggregate (4) 4Q’15 3Q’15 4Q’14
Mexico $ 4.5 $16.5 $ 8.0 $25.5 $54.5 $55.1 $ 58.1 4.7% 4.7% 5.7%
Korea 1.5 9.3 3.0 19.7 33.5 34.4 34.8 0.4 0.5 0.8
India 3.1 8.1 9.1 6.3 26.6 26.7 25.1 0.8 0.6 0.9
Singapore — 5.6 5.3 13.5 24.4 25.3 26.6 0.3 0.3 0.2
Hong Kong 1.6 4.6 7.3 10.7 24.2 24.0 23.1 0.7 0.3 0.5
Brazil 2.8 2.7 13.5 2.8 21.8 20.9 24.7 9.0 5.4 6.8
China 2.2 3.4 7.1 4.8 17.5 18.8 19.6 0.9 0.6 0.9
Taiwan 1.2 0.7 3.5 7.7 13.1 13.6 13.4 0.4 0.3 0.2
Poland 0.7 4.1 1.5 2.7 9.0 9.1 10.0 (0.7) 0.4 (1.7)
Malaysia 0.4 0.3 1.6 4.6 6.9 6.5 8.3 0.7 0.8 0.7
Colombia — 0.4 2.4 1.6 4.4 4.6 4.8 3.4 3.0 3.4
Thailand 0.2 1.2 0.9 1.9 4.2 4.4 4.5 3.2 2.9 2.8
UAE (0.2) — 2.6 1.6 4.0 3.9 3.8 3.4 2.7 1.9
Russia (5) 0.2 0.5 2.4 0.9 4.0 4.7 6.2 3.1 3.4 2.8
Indonesia 0.1 0.7 1.7 1.2 3.7 3.9 4.4 7.8 6.7 3.3
Turkey (0.3) 0.3 2.5 0.7 3.2 3.6 5.6 0.5 (0.3)(0.1)
Argentina (5) 0.4 0.4 1.3 1.1 3.2 3.8 2.9 0.4 0.6 1.0
Philippines 0.1 0.4 0.6 1.0 2.1 2.2 2.5 3.6 3.7 3.8
South Africa — 0.8 1.1 — 1.9 2.7 3.3 —— —
Chile — — 1.8 — 1.8 1.6 1.1 —— —
Note: Aggregate may not cross-foot due to rounding. Prior periods have been reclassified to conform to current period presentation.
(1) Trading account assets are shown on a net basis and include derivative exposures where the underlying reference entity is located in that country. Does not include counterparty credit exposures.
(2) Investment securities include securities available-for-sale, recorded at fair market value, and securities held-to-maturity, recorded at historical cost. Does not include investments accounted for under the equity method.
(3) Corporate loans reflect funded loans within ICG, excluding the private bank, net of unearned income. In addition to the funded loans disclosed in the table above, through its ICG businesses (excluding the private
bank), Citi had unfunded commitments to corporate customers in the emerging markets of approximately $34 billion as of December 31, 2015 (compared to $32 billion and $33 billion as of September 30, 2015 and
December 31, 2014, respectively); no single country accounted for more than $4 billion of this amount. For information on private bank loans, see the narrative to the table below.
(4) Aggregate of Trading account assets, Investment securities, Corporate loans and GCB loans, based on the methodologies described above.
(5) For additional information on Citi’s exposures in Russia and Argentina, see below.
COUNTRY RISK