Citibank 2015 Annual Report Download - page 268
Download and view the complete annual report
Please find page 268 of the 2015 Citibank annual report below. You can navigate through the pages in the report by either clicking on the pages listed below, or by using the keyword search tool below to find specific information within the annual report.-
 1
1 -
2
-
3
-
4
-
5
-
6
-
7
-
8
-
9
-
10
-
11
-
12
-
13
-
14
-
15
-
16
-
17
-
18
-
19
-
20
-
21
-
22
-
23
-
24
-
25
-
26
-
27
-
28
-
29
-
30
-
31
-
32
-
33
-
34
-
35
-
36
-
37
-
38
-
39
-
40
-
41
-
42
-
43
-
44
-
45
-
46
-
47
-
48
-
49
-
50
-
51
-
52
-
53
-
54
-
55
-
56
-
57
-
58
-
59
-
60
-
61
-
62
-
63
-
64
-
65
-
66
-
67
-
68
-
69
-
70
-
71
-
72
-
73
-
74
-
75
-
76
-
77
-
78
-
79
-
80
-
81
-
82
-
83
-
84
-
85
-
86
-
87
-
88
-
89
-
90
-
91
-
92
-
93
-
94
-
95
-
96
-
97
-
98
-
99
-
100
-
101
-
102
-
103
-
104
-
105
-
106
-
107
-
108
-
109
-
110
-
111
-
112
-
113
-
114
-
115
-
116
-
117
-
118
-
119
-
120
-
121
-
122
-
123
-
124
-
125
-
126
-
127
-
128
-
129
-
130
-
131
-
132
-
133
-
134
-
135
-
136
-
137
-
138
-
139
-
140
-
141
-
142
-
143
-
144
-
145
-
146
-
147
-
148
-
149
-
150
-
151
-
152
-
153
-
154
-
155
-
156
-
157
-
158
-
159
-
160
-
161
-
162
-
163
-
164
-
165
-
166
-
167
-
168
-
169
-
170
-
171
-
172
-
173
-
174
-
175
-
176
-
177
-
178
-
179
-
180
-
181
-
182
-
183
-
184
-
185
-
186
-
187
-
188
-
189
-
190
-
191
-
192
-
193
-
194
-
195
-
196
-
197
-
198
-
199
-
200
-
201
-
202
-
203
-
204
-
205
-
206
-
207
-
208
-
209
-
210
-
211
-
212
-
213
-
214
-
215
-
216
-
217
-
218
-
219
-
220
-
221
-
222
-
223
-
224
-
225
-
226
-
227
-
228
-
229
-
230
-
231
-
232
-
233
-
234
-
235
-
236
-
237
-
238
-
239
-
240
-
241
-
242
-
243
-
244
-
245
-
246
-
247
-
248
-
249
-
250
-
251
-
252
-
253
-
254
-
255
-
256
-
257
-
 258
258 -
 259
259 -
 260
260 -
 261
261 -
 262
262 -
 263
263 -
 264
264 -
 265
265 -
 266
266 -
 267
267 -
 268
268 -
 269
269 -
 270
270 -
 271
271 -
 272
272 -
 273
273 -
 274
274 -
 275
275 -
 276
276 -
 277
277 -
 278
278 -
279
-
280
-
281
-
282
-
283
-
284
-
285
-
286
-
287
-
288
-
289
-
290
-
291
-
292
-
293
-
294
-
295
-
296
-
297
-
298
-
299
-
300
-
301
-
302
-
303
-
304
-
305
-
306
-
307
-
308
-
309
-
310
-
311
-
312
-
313
-
314
-
315
-
316
-
317
-
318
-
319
-
320
-
321
-
322
-
323
-
324
-
325
-
326
-
327
-
328
-
329
-
330
-
331
-
332
 |
 |

250
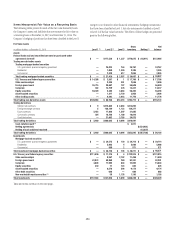
Liquidity adjustments are applied to items in Level 2 or Level 3 of the
fair-value hierarchy in an effort to ensure that the fair value reflects the
price at which the net open risk position could be liquidated. The liquidity
adjustment is based on the bid/offer spread for an instrument. When Citi
has elected to measure certain portfolios of financial investments, such as
derivatives, on the basis of the net open risk position, the liquidity adjustment
may be adjusted to take into account the size of the position.
Credit valuation adjustments (CVA) and, effective in the third quarter
of 2014, funding valuation adjustments (FVA), are applied to over-the-
counter (OTC) derivative instruments in which the base valuation generally
discounts expected cash flows using the relevant base interest rate curve
for the currency of the derivative (e.g., LIBOR for uncollateralized U.S.-
dollar derivatives). As not all counterparties have the same credit risk as
that implied by the relevant base curve, a CVA is necessary to incorporate
the market view of both counterparty credit risk and Citi’s own credit risk
in the valuation. FVA reflects a market funding risk premium inherent in
the uncollateralized portion of derivative portfolios, and in collateralized
derivatives where the terms of the agreement do not permit the reuse of the
collateral received.
Citi’s CVA and FVA methodology is composed of two steps:
• First, the exposure profile for each counterparty is determined using the
terms of all individual derivative positions and a Monte Carlo simulation
or other quantitative analysis to generate a series of expected cash flows
at future points in time. The calculation of this exposure profile considers
the effect of credit risk mitigants and sources of funding, including
pledged cash or other collateral and any legal right of offset that exists
with a counterparty through arrangements such as netting agreements.
Individual derivative contracts that are subject to an enforceable master
netting agreement with a counterparty are aggregated as a netting set
for this purpose, since it is those aggregate net cash flows that are subject
to nonperformance risk. This process identifies specific, point-in-time
future cash flows that are subject to nonperformance risk and unsecured
funding, rather than using the current recognized net asset or liability as
a basis to measure the CVA and FVA.
• Second, for CVA, market-based views of default probabilities derived
from observed credit spreads in the credit default swap (CDS) market
are applied to the expected future cash flows determined in step one.
Citi’s own-credit CVA is determined using Citi-specific CDS spreads for
the relevant tenor. Generally, counterparty CVA is determined using CDS
spread indices for each credit rating and tenor. For certain identified
netting sets where individual analysis is practicable (e.g., exposures to
counterparties with liquid CDSs), counterparty-specific CDS spreads are
used. For FVA, a term structure of future liquidity spreads is applied to the
expected future funding requirement.
The CVA and FVA are designed to incorporate a market view of the credit
and funding risk, respectively, inherent in the derivative portfolio. However,
most unsecured derivative instruments are negotiated bilateral contracts
and are not commonly transferred to third parties. Derivative instruments
are normally settled contractually or, if terminated early, are terminated at
a value negotiated bilaterally between the counterparties. Thus, the CVA and
FVA may not be realized upon a settlement or termination in the normal
course of business. In addition, all or a portion of these adjustments may be
reversed or otherwise adjusted in future periods in the event of changes in the
credit or funding risk associated with the derivative instruments.
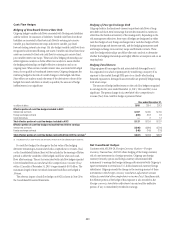
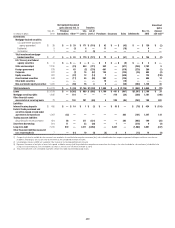
The table below summarizes the CVA and FVA applied to the fair value of
derivative instruments at December 31, 2015 and 2014:
Credit and funding valuation
adjustments
contra-liability (contra-asset)
In millions of dollars
December 31,
2015
December 31,
2014
Counterparty CVA $(1,470) $(1,853)
Asset FVA (584) (518)
Citigroup (own-credit) CVA 471 580
Liability FVA 106 19
Total CVA—derivative instruments (1) $(1,477) $(1,772)
(1) FVA is included with CVA for presentation purposes.
The table below summarizes pretax gains (losses) related to changes in
CVA on derivative instruments, net of hedges, FVA on derivatives and debt
valuation adjustments (DVA) on Citi’s own fair value option (FVO) liabilities
for the years indicated:
Credit/funding/debt valuation
adjustments gain (loss)
In millions of dollars 2015 2014 2013
Counterparty CVA $(115) $ (43) $ 291
Asset FVA (66) (518) —
Own-credit CVA (28) (65) (223)
Liability FVA 98 19 —
Total CVA—derivative instruments $(111) $(607) $ 68
DVA related to own FVO liabilities $ 366 $ 217 $ (410)
Total CVA and DVA (1) $ 255 $(390) $ (342)
(1) FVA is included with CVA for presentation purposes.