Citibank 2015 Annual Report Download - page 255
Download and view the complete annual report
Please find page 255 of the 2015 Citibank annual report below. You can navigate through the pages in the report by either clicking on the pages listed below, or by using the keyword search tool below to find specific information within the annual report.-
 1
1 -
2
-
3
-
4
-
5
-
6
-
7
-
8
-
9
-
10
-
11
-
12
-
13
-
14
-
15
-
16
-
17
-
18
-
19
-
20
-
21
-
22
-
23
-
24
-
25
-
26
-
27
-
28
-
29
-
30
-
31
-
32
-
33
-
34
-
35
-
36
-
37
-
38
-
39
-
40
-
41
-
42
-
43
-
44
-
45
-
46
-
47
-
48
-
49
-
50
-
51
-
52
-
53
-
54
-
55
-
56
-
57
-
58
-
59
-
60
-
61
-
62
-
63
-
64
-
65
-
66
-
67
-
68
-
69
-
70
-
71
-
72
-
73
-
74
-
75
-
76
-
77
-
78
-
79
-
80
-
81
-
82
-
83
-
84
-
85
-
86
-
87
-
88
-
89
-
90
-
91
-
92
-
93
-
94
-
95
-
96
-
97
-
98
-
99
-
100
-
101
-
102
-
103
-
104
-
105
-
106
-
107
-
108
-
109
-
110
-
111
-
112
-
113
-
114
-
115
-
116
-
117
-
118
-
119
-
120
-
121
-
122
-
123
-
124
-
125
-
126
-
127
-
128
-
129
-
130
-
131
-
132
-
133
-
134
-
135
-
136
-
137
-
138
-
139
-
140
-
141
-
142
-
143
-
144
-
145
-
146
-
147
-
148
-
149
-
150
-
151
-
152
-
153
-
154
-
155
-
156
-
157
-
158
-
159
-
160
-
161
-
162
-
163
-
164
-
165
-
166
-
167
-
168
-
169
-
170
-
171
-
172
-
173
-
174
-
175
-
176
-
177
-
178
-
179
-
180
-
181
-
182
-
183
-
184
-
185
-
186
-
187
-
188
-
189
-
190
-
191
-
192
-
193
-
194
-
195
-
196
-
197
-
198
-
199
-
200
-
201
-
202
-
203
-
204
-
205
-
206
-
207
-
208
-
209
-
210
-
211
-
212
-
213
-
214
-
215
-
216
-
217
-
218
-
219
-
220
-
221
-
222
-
223
-
224
-
225
-
226
-
227
-
228
-
229
-
230
-
231
-
232
-
233
-
234
-
235
-
236
-
237
-
238
-
239
-
240
-
241
-
242
-
243
-
244
-
 245
245 -
 246
246 -
 247
247 -
 248
248 -
 249
249 -
 250
250 -
 251
251 -
 252
252 -
 253
253 -
 254
254 -
 255
255 -
 256
256 -
 257
257 -
 258
258 -
 259
259 -
 260
260 -
 261
261 -
 262
262 -
 263
263 -
 264
264 -
 265
265 -
266
-
267
-
268
-
269
-
270
-
271
-
272
-
273
-
274
-
275
-
276
-
277
-
278
-
279
-
280
-
281
-
282
-
283
-
284
-
285
-
286
-
287
-
288
-
289
-
290
-
291
-
292
-
293
-
294
-
295
-
296
-
297
-
298
-
299
-
300
-
301
-
302
-
303
-
304
-
305
-
306
-
307
-
308
-
309
-
310
-
311
-
312
-
313
-
314
-
315
-
316
-
317
-
318
-
319
-
320
-
321
-
322
-
323
-
324
-
325
-
326
-
327
-
328
-
329
-
330
-
331
-
332
 |
 |

237
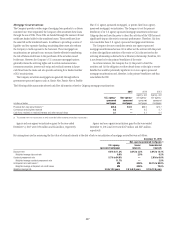
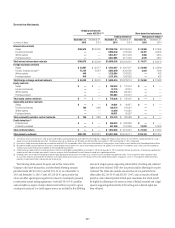
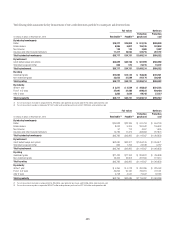
Derivative Notionals
Hedging instruments
under ASC 815 (1)(2) Other derivative instruments
Trading derivatives Management hedges (3)
In millions of dollars
December 31,
2015
December 31,
2014 December 31,
2015
December 31,
2014
December 31,
2015
December 31,
2014
Interest rate contracts
Swaps $166,576 $163,348 $22,208,794 $31,906,549 $ 28,969 $ 31,945
Futures and forwards ——6,868,340 7,044,990 38,421 42,305
Written options ——3,033,617 3,311,904 2,606 3,913
Purchased options ——2,887,605 3,171,184 4,575 4,910
Total interest rate contract notionals $166,576 $163,348 $34,998,356 $45,434,627 $ 74,571 $ 83,073
Foreign exchange contracts
Swaps $ 23,007 $ 25,157 $ 4,765,687 $ 4,567,977 $ 23,960 $ 23,990
Futures, forwards and spot (4) 72,124 73,219 2,563,649 3,003,295 3,034 7,069
Written options 448 —1,125,664 1,343,520 —432
Purchased options 819 —1,131,816 1,363,382 —432
Total foreign exchange contract notionals $ 96,398 $ 98,376 $ 9,586,816 $10,278,174 $ 26,994 $ 31,923
Equity contracts
Swaps $ — $ — $ 180,963 $ 131,344 $ — $ —
Futures and forwards ——33,735 30,510 ——
Written options ——298,876 305,627 ——
Purchased options ——265,062 275,216 ——
Total equity contract notionals $ — $ — $ 778,636 $ 742,697 $ — $ —
Commodity and other contracts
Swaps $ — $ — $ 70,561 $ 90,817 $ — $ —
Futures and forwards 789 1,089 106,474 106,021 ——
Written options ——72,648 104,581 ——
Purchased options ——66,051 95,567 ——
Total commodity and other contract notionals $ 789 $ 1,089 $ 315,734 $ 396,986 $ — $ —
Credit derivatives (5)
Protection sold $ — $ — $ 950,922 $ 1,063,858 $ — $ —
Protection purchased ——981,586 1,100,369 23,628 16,018
Total credit derivatives $ — $ — $ 1,932,508 $ 2,164,227 $ 23,628 $ 16,018
Total derivative notionals $263,763 $262,813 $47,612,050 $59,016,711 $125,193 $131,014
(1) The notional amounts presented in this table do not include hedge accounting relationships under ASC 815 where Citigroup is hedging the foreign currency risk of a net investment in a foreign operation by issuing a
foreign-currency-denominated debt instrument. The notional amount of such debt was $2,102 million and $3,752 million at December 31, 2015 and December 31, 2014, respectively.
(2) Derivatives in hedge accounting relationships accounted for under ASC 815 are recorded in either Other assets/Other liabilities or Trading account assets/Trading account liabilities on the Consolidated Balance Sheet.
(3) Management hedges represent derivative instruments used to mitigate certain economic risks, but for which hedge accounting is not applied. These derivatives are recorded in either Other assets/Other liabilities or
Trading account assets/Trading account liabilities on the Consolidated Balance Sheet.
(4) Foreign exchange notional contracts include spot contract notionals of $335 billion and $849 billion at December 31, 2015 and December 31, 2014, respectively. Previous presentations of foreign exchange derivative
notional contracts did not include spot contracts. There was no impact to the Consolidated Financial Statements related to this updated presentation.
(5) Credit derivatives are arrangements designed to allow one party (protection buyer) to transfer the credit risk of a “reference asset” to another party (protection seller). These arrangements allow a protection seller
to assume the credit risk associated with the reference asset without directly purchasing that asset. The Company enters into credit derivative positions for purposes such as risk management, yield enhancement,
reduction of credit concentrations and diversification of overall risk.
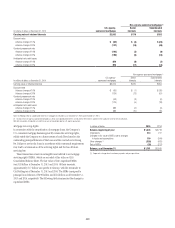
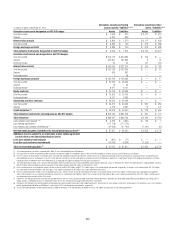
The following tables present the gross and net fair values of the
Company’s derivative transactions, and the related offsetting amounts
permitted under ASC 210-20-45 and ASC 815-10-45, as of December 31,
2015 and December 31, 2014. Under ASC 210-20-45, gross positive fair
values are offset against gross negative fair values by counterparty pursuant
to enforceable master netting agreements. Under ASC 815-10-45, payables
and receivables in respect of cash collateral received from or paid to a given
counterparty pursuant to a credit support annex are included in the offsetting
amount if a legal opinion supporting enforceability of netting and collateral
rights has been obtained. GAAP does not permit similar offsetting for security
collateral. The tables also include amounts that are not permitted to be
offset under ASC 210-20-45 and ASC 815-10-45, such as security collateral
posted or cash collateral posted at third-party custodians, but which would
be eligible for offsetting to the extent an event of default occurred and a legal
opinion supporting enforceability of the netting and collateral rights has
been obtained.