Citibank 2015 Annual Report Download - page 103
Download and view the complete annual report
Please find page 103 of the 2015 Citibank annual report below. You can navigate through the pages in the report by either clicking on the pages listed below, or by using the keyword search tool below to find specific information within the annual report.-
 1
1 -
2
-
3
-
4
-
5
-
6
-
7
-
8
-
9
-
10
-
11
-
12
-
13
-
14
-
15
-
16
-
17
-
18
-
19
-
20
-
21
-
22
-
23
-
24
-
25
-
26
-
27
-
28
-
29
-
30
-
31
-
32
-
33
-
34
-
35
-
36
-
37
-
38
-
39
-
40
-
41
-
42
-
43
-
44
-
45
-
46
-
47
-
48
-
49
-
50
-
51
-
52
-
53
-
54
-
55
-
56
-
57
-
58
-
59
-
60
-
61
-
62
-
63
-
64
-
65
-
66
-
67
-
68
-
69
-
70
-
71
-
72
-
73
-
74
-
75
-
76
-
77
-
78
-
79
-
80
-
81
-
82
-
83
-
84
-
85
-
86
-
87
-
88
-
89
-
90
-
91
-
92
-
 93
93 -
 94
94 -
 95
95 -
 96
96 -
 97
97 -
 98
98 -
 99
99 -
 100
100 -
 101
101 -
 102
102 -
 103
103 -
 104
104 -
 105
105 -
 106
106 -
 107
107 -
 108
108 -
 109
109 -
 110
110 -
 111
111 -
 112
112 -
 113
113 -
114
-
115
-
116
-
117
-
118
-
119
-
120
-
121
-
122
-
123
-
124
-
125
-
126
-
127
-
128
-
129
-
130
-
131
-
132
-
133
-
134
-
135
-
136
-
137
-
138
-
139
-
140
-
141
-
142
-
143
-
144
-
145
-
146
-
147
-
148
-
149
-
150
-
151
-
152
-
153
-
154
-
155
-
156
-
157
-
158
-
159
-
160
-
161
-
162
-
163
-
164
-
165
-
166
-
167
-
168
-
169
-
170
-
171
-
172
-
173
-
174
-
175
-
176
-
177
-
178
-
179
-
180
-
181
-
182
-
183
-
184
-
185
-
186
-
187
-
188
-
189
-
190
-
191
-
192
-
193
-
194
-
195
-
196
-
197
-
198
-
199
-
200
-
201
-
202
-
203
-
204
-
205
-
206
-
207
-
208
-
209
-
210
-
211
-
212
-
213
-
214
-
215
-
216
-
217
-
218
-
219
-
220
-
221
-
222
-
223
-
224
-
225
-
226
-
227
-
228
-
229
-
230
-
231
-
232
-
233
-
234
-
235
-
236
-
237
-
238
-
239
-
240
-
241
-
242
-
243
-
244
-
245
-
246
-
247
-
248
-
249
-
250
-
251
-
252
-
253
-
254
-
255
-
256
-
257
-
258
-
259
-
260
-
261
-
262
-
263
-
264
-
265
-
266
-
267
-
268
-
269
-
270
-
271
-
272
-
273
-
274
-
275
-
276
-
277
-
278
-
279
-
280
-
281
-
282
-
283
-
284
-
285
-
286
-
287
-
288
-
289
-
290
-
291
-
292
-
293
-
294
-
295
-
296
-
297
-
298
-
299
-
300
-
301
-
302
-
303
-
304
-
305
-
306
-
307
-
308
-
309
-
310
-
311
-
312
-
313
-
314
-
315
-
316
-
317
-
318
-
319
-
320
-
321
-
322
-
323
-
324
-
325
-
326
-
327
-
328
-
329
-
330
-
331
-
332
 |
 |

85
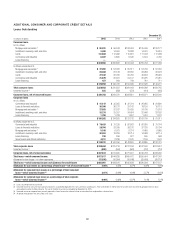
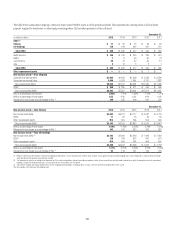
Non-Accrual Loans and Assets
The table below summarizes Citigroup’s non-accrual loans as of the periods
indicated. Non-accrual loans may still be current on interest payments. In
situations where Citi reasonably expects that only a portion of the principal
owed will ultimately be collected, all payments received are reflected as a
reduction of principal and not as interest income. For all other non-accrual
loans, cash interest receipts are generally recorded as revenue.
December 31,
In millions of dollars 2015 2014 2013 2012 2011
Citicorp $3,092 $3,011 $3,777 $ 4,031 $ 3,776
Citi Holdings 2,162 4,096 5,226 7,499 7,292
Total non-accrual loans $ 5,254 $ 7,107 $ 9,003 $11,530 $11,068
Corporate non-accrual loans (1)(2)
North America $ 818 $ 321 $ 736 $ 735 $ 1,246
EMEA 317 267 766 1,131 1,293
Latin America 301 416 127 128 362
Asia 128 179 279 339 335
Total corporate non-accrual loans $1,564 $ 1,183 $ 1,908 $ 2,333 $ 3,236
Citicorp $1,511 $1,126 $ 1,580 $ 1,909 $ 2,217
Citi Holdings 53 57 328 424 1,019
Total corporate non-accrual loans $1,564 $ 1,183 $ 1,908 $ 2,333 $ 3,236
Consumer non-accrual loans (1)(3)
North America $2,515 $4,412 $ 5,238 $ 7,149 $ 5,888
Latin America 876 1,188 1,426 1,285 1,107
Asia (4) 299 324 431 763 837
Total consumer non-accrual loans $3,690 $ 5,924 $ 7,095 $ 9,197 $ 7,832
Citicorp $1,581 $1,885 $ 2,197 $ 2,122 $ 1,559
Citi Holdings 2,109 4,039 4,898 7,075 6,273
Total consumer non-accrual loans $3,690 $ 5,924 $ 7,095 $ 9,197 $ 7,832
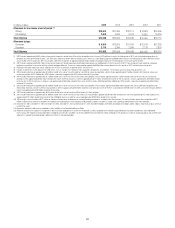
(1) Excludes purchased distressed loans, as they are generally accreting interest. The carrying value of these loans was $250 million at December 31, 2015, $421 million at December 31, 2014, $703 million at
December 31, 2013, $537 million at December 31, 2012 and $511 million at December 31, 2011.
(2) Included within the increase in corporate non-accrual loans from December 31, 2014 to December 31, 2015 is an approximate $340 million increase during the third quarter of 2015 primarily related to Citi’s North
America energy and energy-related corporate credit exposure. For additional information, see “Corporate Credit Details” above.
(3) 2015 decline includes the impact related to the transfer of approximately $8 billion of mortgage loans to Loans, held-for-sale (HFS) (included within Other assets).
(4) For reporting purposes, Asia GCB includes the results of operations of EMEA GCB for all periods presented.
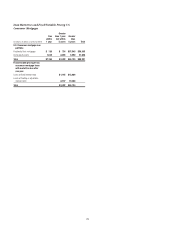
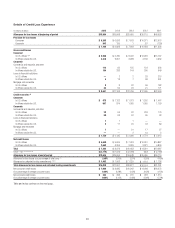
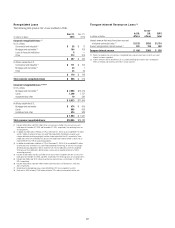
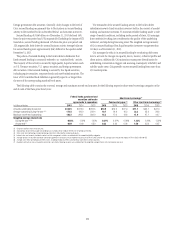
The changes in Citigroup’s non-accrual loans were as follows:
Year ended December 31, 2015
In millions of dollars Corporate Consumer Total
Non-accrual loans at beginning
of period $1,183 $ 5,924 $ 7,107
Additions 1,318 5,219 6,537
Sales and transfers to held-for-sale (222) (2,249) (2,471)
Returned to performing (64) (1,080) (1,144)
Paydowns/settlements (459) (1,255) (1,714)
Charge-offs (145) (2,642) (2,787)
Other (47) (227) (274)
Ending balance $1,564 $ 3,690 $ 5,254