Citibank 2015 Annual Report Download - page 207
Download and view the complete annual report
Please find page 207 of the 2015 Citibank annual report below. You can navigate through the pages in the report by either clicking on the pages listed below, or by using the keyword search tool below to find specific information within the annual report.-
 1
1 -
2
-
3
-
4
-
5
-
6
-
7
-
8
-
9
-
10
-
11
-
12
-
13
-
14
-
15
-
16
-
17
-
18
-
19
-
20
-
21
-
22
-
23
-
24
-
25
-
26
-
27
-
28
-
29
-
30
-
31
-
32
-
33
-
34
-
35
-
36
-
37
-
38
-
39
-
40
-
41
-
42
-
43
-
44
-
45
-
46
-
47
-
48
-
49
-
50
-
51
-
52
-
53
-
54
-
55
-
56
-
57
-
58
-
59
-
60
-
61
-
62
-
63
-
64
-
65
-
66
-
67
-
68
-
69
-
70
-
71
-
72
-
73
-
74
-
75
-
76
-
77
-
78
-
79
-
80
-
81
-
82
-
83
-
84
-
85
-
86
-
87
-
88
-
89
-
90
-
91
-
92
-
93
-
94
-
95
-
96
-
97
-
98
-
99
-
100
-
101
-
102
-
103
-
104
-
105
-
106
-
107
-
108
-
109
-
110
-
111
-
112
-
113
-
114
-
115
-
116
-
117
-
118
-
119
-
120
-
121
-
122
-
123
-
124
-
125
-
126
-
127
-
128
-
129
-
130
-
131
-
132
-
133
-
134
-
135
-
136
-
137
-
138
-
139
-
140
-
141
-
142
-
143
-
144
-
145
-
146
-
147
-
148
-
149
-
150
-
151
-
152
-
153
-
154
-
155
-
156
-
157
-
158
-
159
-
160
-
161
-
162
-
163
-
164
-
165
-
166
-
167
-
168
-
169
-
170
-
171
-
172
-
173
-
174
-
175
-
176
-
177
-
178
-
179
-
180
-
181
-
182
-
183
-
184
-
185
-
186
-
187
-
188
-
189
-
190
-
191
-
192
-
193
-
194
-
195
-
196
-
 197
197 -
 198
198 -
 199
199 -
 200
200 -
 201
201 -
 202
202 -
 203
203 -
 204
204 -
 205
205 -
 206
206 -
 207
207 -
 208
208 -
 209
209 -
 210
210 -
 211
211 -
 212
212 -
 213
213 -
 214
214 -
 215
215 -
 216
216 -
 217
217 -
218
-
219
-
220
-
221
-
222
-
223
-
224
-
225
-
226
-
227
-
228
-
229
-
230
-
231
-
232
-
233
-
234
-
235
-
236
-
237
-
238
-
239
-
240
-
241
-
242
-
243
-
244
-
245
-
246
-
247
-
248
-
249
-
250
-
251
-
252
-
253
-
254
-
255
-
256
-
257
-
258
-
259
-
260
-
261
-
262
-
263
-
264
-
265
-
266
-
267
-
268
-
269
-
270
-
271
-
272
-
273
-
274
-
275
-
276
-
277
-
278
-
279
-
280
-
281
-
282
-
283
-
284
-
285
-
286
-
287
-
288
-
289
-
290
-
291
-
292
-
293
-
294
-
295
-
296
-
297
-
298
-
299
-
300
-
301
-
302
-
303
-
304
-
305
-
306
-
307
-
308
-
309
-
310
-
311
-
312
-
313
-
314
-
315
-
316
-
317
-
318
-
319
-
320
-
321
-
322
-
323
-
324
-
325
-
326
-
327
-
328
-
329
-
330
-
331
-
332
 |
 |

189
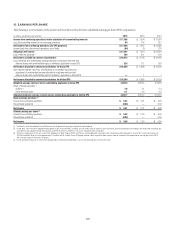
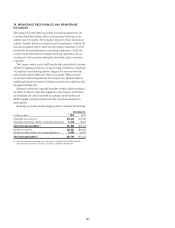
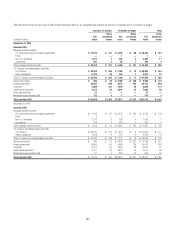
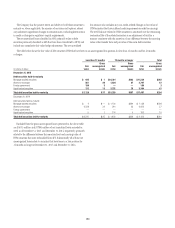
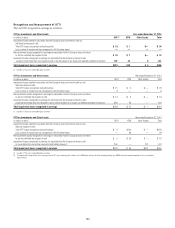
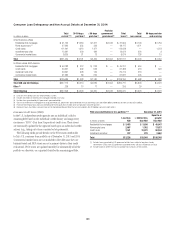
Debt Securities Held-to-Maturity
The carrying value and fair value of debt securities HTM were as follows:
In millions of dollars
Amortized
cost basis (1)
Net unrealized
gains (losses)
recognized in
AOCI
Carrying
value (2)
Gross
unrealized
gains
Gross
unrealized
(losses)
Fair
value
December 31, 2015
Debt securities held-to-maturity
Mortgage-backed securities (3)
U.S. government agency guaranteed $17,648 $ 138 $17,786 $ 71 $(100) $17,757
Prime 121 (78) 43 3 (1) 45
Alt-A 433 (1) 432 259 (162) 529
Subprime 2 — 2 13 — 15
Non-U.S. residential 1,330 (60) 1,270 37 — 1,307
Commercial — — — — — —
Total mortgage-backed securities $19,534 $ (1) $19,533 $ 383 $(263) $19,653
State and municipal (4) $ 8,581 $(438) $ 8,143 $ 245 $ (87) $ 8,301
Foreign government 4,068 — 4,068 28 (3) 4,093
Asset-backed securities (3) 4,485 (14) 4,471 34 (41) 4,464
Total debt securities held-to-maturity $36,668 $(453) $36,215 $ 690 $(394) $36,511
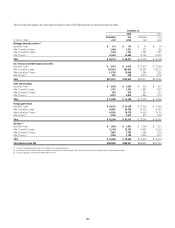
December 31, 2014
Debt securities held-to-maturity
Mortgage-backed securities (3)
U.S. government agency guaranteed $ 8,795 $ 95 $ 8,890 $ 106 $ (6) $ 8,990
Prime 60 (12) 48 6 (1) 53
Alt-A 1,125 (213) 912 537 (287) 1,162
Subprime 6 (1) 5 15 — 20
Non-U.S. residential 983 (137) 846 92 — 938
Commercial 8 — 8 1 — 9
Total mortgage-backed securities $10,977 $(268) $10,709 $ 757 $(294) $11,172
State and municipal $ 8,443 $(494) $ 7,949 $ 227 $ (57) $ 8,119
Foreign government 4,725 — 4,725 77 — 4,802
Asset-backed securities (3) 556 (18) 538 50 (10) 578
Total debt securities held-to-maturity (5) $24,701 $ (780) $23,921 $ 1,111 $ (361) $24,671
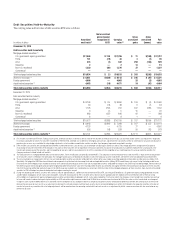
(1) For securities transferred to HTM from Trading account assets, amortized cost basis is defined as the fair value of the securities at the date of transfer plus any accretion income and less any impairments recognized
in earnings subsequent to transfer. For securities transferred to HTM from AFS, amortized cost is defined as the original purchase cost, adjusted for the cumulative accretion or amortization of any purchase discount or
premium, plus or minus any cumulative fair value hedge adjustments, net of accretion or amortization, and less any other-than-temporary impairment recognized in earnings.
(2) HTM securities are carried on the Consolidated Balance Sheet at amortized cost basis, plus or minus any unamortized unrealized gains and losses and fair value hedge adjustments recognized in AOCI prior to
reclassifying the securities from AFS to HTM. Changes in the values of these securities are not reported in the financial statements, except for the amortization of any difference between the carrying value at the
transfer date and par value of the securities, and the recognition of any non-credit fair value adjustments in AOCI in connection with the recognition of any credit impairment in earnings related to securities the
Company continues to intend to hold until maturity.
(3) The Company invests in mortgage-backed and asset-backed securities. These securitizations are generally considered VIEs. The Company’s maximum exposure to loss from these VIEs is equal to the carrying amount
of the securities, which is reflected in the table above. For mortgage-backed and asset-backed securitizations in which the Company has other involvement, see Note 22 to the Consolidated Financial Statements.
(4) The net unrealized losses recognized in AOCI on state and municipal debt securities are primarily attributable to the effects of fair value hedge accounting applied when these debt securities were classified as AFS.
Specifically, Citi hedged the LIBOR-benchmark interest rate component of certain fixed-rate tax-exempt state and municipal debt securities utilizing LIBOR-based interest rate swaps. During the hedge period, losses
incurred on the LIBOR-hedging swaps recorded in earnings were substantially offset by gains on the state and municipal debt securities attributable to changes in the LIBOR swap rate being hedged. However, because
the LIBOR swap rate decreased significantly during the hedge period while the overall fair value of the municipal debt securities was relatively unchanged, the effect of reclassifying fair value gains on these securities
from AOCI to earnings attributable solely to changes in the LIBOR swap rate resulted in net unrealized losses remaining in AOCI that relate to the unhedged components of these securities. Upon transfer of these debt
securities to HTM, all hedges have been de-designated and hedge accounting has ceased.
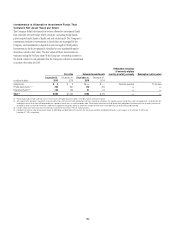
(5) During the second quarter of 2015, securities with a total fair value of approximately $7.1 billion were transferred from AFS to HTM, consisting of $7.0 billion of U.S. government agency mortgage-backed securities
and $0.1 billion of obligations of U.S. states and municipalities. During the second quarter of 2014, securities with a total fair value of approximately $11.8 billion were transferred from AFS to HTM, consisting
of $5.4 billion of U.S. government agency mortgage-backed securities and $6.4 billion of obligations of U.S. states and municipalities. The transfer reflects the Company’s intent to hold these securities to maturity or
to issuer call in order to reduce the impact of price volatility on AOCI and certain capital measures under Basel III. While these securities were transferred to HTM at fair value as of the transfer date, no subsequent
changes in value may be recorded, other than in connection with the recognition of any subsequent other-than-temporary impairment and the amortization of differences between the carrying values at the transfer
date and the par values of each security as an adjustment of yield over the remaining contractual life of each security. Any net unrealized holding losses within AOCI related to the respective securities at the date of
transfer, inclusive of any cumulative fair value hedge adjustments, will be amortized over the remaining contractual life of each security as an adjustment of yield in a manner consistent with the amortization of any
premium or discount.