Citibank 2015 Annual Report Download - page 223
Download and view the complete annual report
Please find page 223 of the 2015 Citibank annual report below. You can navigate through the pages in the report by either clicking on the pages listed below, or by using the keyword search tool below to find specific information within the annual report.-
 1
1 -
2
-
3
-
4
-
5
-
6
-
7
-
8
-
9
-
10
-
11
-
12
-
13
-
14
-
15
-
16
-
17
-
18
-
19
-
20
-
21
-
22
-
23
-
24
-
25
-
26
-
27
-
28
-
29
-
30
-
31
-
32
-
33
-
34
-
35
-
36
-
37
-
38
-
39
-
40
-
41
-
42
-
43
-
44
-
45
-
46
-
47
-
48
-
49
-
50
-
51
-
52
-
53
-
54
-
55
-
56
-
57
-
58
-
59
-
60
-
61
-
62
-
63
-
64
-
65
-
66
-
67
-
68
-
69
-
70
-
71
-
72
-
73
-
74
-
75
-
76
-
77
-
78
-
79
-
80
-
81
-
82
-
83
-
84
-
85
-
86
-
87
-
88
-
89
-
90
-
91
-
92
-
93
-
94
-
95
-
96
-
97
-
98
-
99
-
100
-
101
-
102
-
103
-
104
-
105
-
106
-
107
-
108
-
109
-
110
-
111
-
112
-
113
-
114
-
115
-
116
-
117
-
118
-
119
-
120
-
121
-
122
-
123
-
124
-
125
-
126
-
127
-
128
-
129
-
130
-
131
-
132
-
133
-
134
-
135
-
136
-
137
-
138
-
139
-
140
-
141
-
142
-
143
-
144
-
145
-
146
-
147
-
148
-
149
-
150
-
151
-
152
-
153
-
154
-
155
-
156
-
157
-
158
-
159
-
160
-
161
-
162
-
163
-
164
-
165
-
166
-
167
-
168
-
169
-
170
-
171
-
172
-
173
-
174
-
175
-
176
-
177
-
178
-
179
-
180
-
181
-
182
-
183
-
184
-
185
-
186
-
187
-
188
-
189
-
190
-
191
-
192
-
193
-
194
-
195
-
196
-
197
-
198
-
199
-
200
-
201
-
202
-
203
-
204
-
205
-
206
-
207
-
208
-
209
-
210
-
211
-
212
-
 213
213 -
 214
214 -
 215
215 -
 216
216 -
 217
217 -
 218
218 -
 219
219 -
 220
220 -
 221
221 -
 222
222 -
 223
223 -
 224
224 -
 225
225 -
 226
226 -
 227
227 -
 228
228 -
 229
229 -
 230
230 -
 231
231 -
 232
232 -
 233
233 -
234
-
235
-
236
-
237
-
238
-
239
-
240
-
241
-
242
-
243
-
244
-
245
-
246
-
247
-
248
-
249
-
250
-
251
-
252
-
253
-
254
-
255
-
256
-
257
-
258
-
259
-
260
-
261
-
262
-
263
-
264
-
265
-
266
-
267
-
268
-
269
-
270
-
271
-
272
-
273
-
274
-
275
-
276
-
277
-
278
-
279
-
280
-
281
-
282
-
283
-
284
-
285
-
286
-
287
-
288
-
289
-
290
-
291
-
292
-
293
-
294
-
295
-
296
-
297
-
298
-
299
-
300
-
301
-
302
-
303
-
304
-
305
-
306
-
307
-
308
-
309
-
310
-
311
-
312
-
313
-
314
-
315
-
316
-
317
-
318
-
319
-
320
-
321
-
322
-
323
-
324
-
325
-
326
-
327
-
328
-
329
-
330
-
331
-
332
 |
 |

205
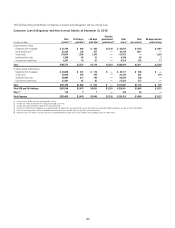
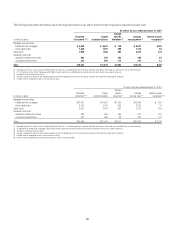
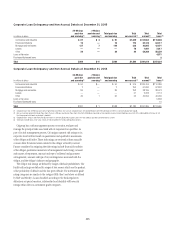
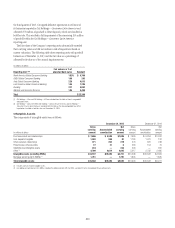
Corporate Loan Delinquency and Non-Accrual Details at December 31, 2015
In millions of dollars
30-89 days
past due
and accruing (1)
≥ 90 days
past due and
accruing (1)
Total past due
and accruing
Total
non-accrual (2)
Total
current (3)
Total
loans (4)
Commercial and industrial $ 87 $ 4 $ 91 $1,039 $114,564 $115,694
Financial institutions 16 — 16 173 64,128 64,317
Mortgage and real estate 137 7 144 232 42,095 42,471
Leases — — — 76 1,941 2,017
Other 29 — 29 44 58,286 58,359
Loans at fair value 4,971
Purchased distressed loans 5
Total $269 $11 $280 $1,564 $281,014 $287,834
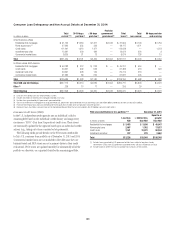
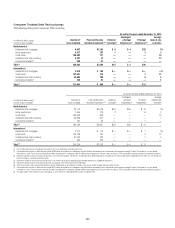
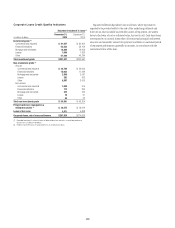
Corporate Loan Delinquency and Non-Accrual Details at December 31, 2014
In millions of dollars
30-89 days
past due
and accruing (1)
≥ 90 days
past due and
accruing (1)
Total past due
and accruing
Total
non-accrual (2)
Total
current (3)
Total
loans (4)
Commercial and industrial $ 50 $— $ 50 $ 575 $109,764 $110,389
Financial institutions 2 — 2 250 67,580 67,832
Mortgage and real estate 86 — 86 252 38,135 38,473
Leases — — — 51 2,062 2,113
Other 49 1 50 55 49,844 49,949
Loans at fair value 5,858
Purchased distressed loans 51
Total $187 $ 1 $188 $1,183 $267,385 $274,665
(1) Corporate loans that are 90 days past due are generally classified as non-accrual. Corporate loans are considered past due when principal or interest is contractually due but unpaid.
(2) Non-accrual loans generally include those loans that are ≥ 90 days past due or those loans for which Citi believes, based on actual experience and a forward-looking assessment of the collectability of the loan in full,
that the payment of interest or principal is doubtful.
(3) Corporate loans are past due when principal or interest is contractually due but unpaid. Loans less than 30 days past due are presented as current.
(4) Total loans include loans at fair value, which are not included in the various delinquency columns.
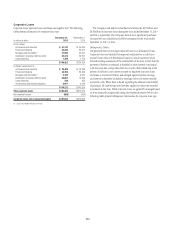
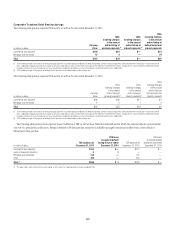
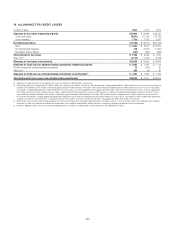
Citigroup has a risk management process to monitor, evaluate and
manage the principal risks associated with its corporate loan portfolio. As
part of its risk management process, Citi assigns numeric risk ratings to its
corporate loan facilities based on quantitative and qualitative assessments
of the obligor and facility. These risk ratings are reviewed at least annually
or more often if material events related to the obligor or facility warrant.
Factors considered in assigning the risk ratings include financial condition
of the obligor, qualitative assessment of management and strategy, amount
and sources of repayment, amount and type of collateral and guarantee
arrangements, amount and type of any contingencies associated with the
obligor, and the obligor’s industry and geography.
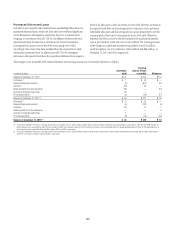
The obligor risk ratings are defined by ranges of default probabilities. The
facility risk ratings are defined by ranges of loss norms, which are the product
of the probability of default and the loss given default. The investment grade
rating categories are similar to the category BBB-/Baa3 and above as defined
by S&P and Moody’s. Loans classified according to the bank regulatory
definitions as special mention, substandard and doubtful will have risk
ratings within the non-investment grade categories.