Citibank 2015 Annual Report Download - page 109
Download and view the complete annual report
Please find page 109 of the 2015 Citibank annual report below. You can navigate through the pages in the report by either clicking on the pages listed below, or by using the keyword search tool below to find specific information within the annual report.-
 1
1 -
2
-
3
-
4
-
5
-
6
-
7
-
8
-
9
-
10
-
11
-
12
-
13
-
14
-
15
-
16
-
17
-
18
-
19
-
20
-
21
-
22
-
23
-
24
-
25
-
26
-
27
-
28
-
29
-
30
-
31
-
32
-
33
-
34
-
35
-
36
-
37
-
38
-
39
-
40
-
41
-
42
-
43
-
44
-
45
-
46
-
47
-
48
-
49
-
50
-
51
-
52
-
53
-
54
-
55
-
56
-
57
-
58
-
59
-
60
-
61
-
62
-
63
-
64
-
65
-
66
-
67
-
68
-
69
-
70
-
71
-
72
-
73
-
74
-
75
-
76
-
77
-
78
-
79
-
80
-
81
-
82
-
83
-
84
-
85
-
86
-
87
-
88
-
89
-
90
-
91
-
92
-
93
-
94
-
95
-
96
-
97
-
98
-
 99
99 -
 100
100 -
 101
101 -
 102
102 -
 103
103 -
 104
104 -
 105
105 -
 106
106 -
 107
107 -
 108
108 -
 109
109 -
 110
110 -
 111
111 -
 112
112 -
 113
113 -
 114
114 -
 115
115 -
 116
116 -
 117
117 -
 118
118 -
 119
119 -
120
-
121
-
122
-
123
-
124
-
125
-
126
-
127
-
128
-
129
-
130
-
131
-
132
-
133
-
134
-
135
-
136
-
137
-
138
-
139
-
140
-
141
-
142
-
143
-
144
-
145
-
146
-
147
-
148
-
149
-
150
-
151
-
152
-
153
-
154
-
155
-
156
-
157
-
158
-
159
-
160
-
161
-
162
-
163
-
164
-
165
-
166
-
167
-
168
-
169
-
170
-
171
-
172
-
173
-
174
-
175
-
176
-
177
-
178
-
179
-
180
-
181
-
182
-
183
-
184
-
185
-
186
-
187
-
188
-
189
-
190
-
191
-
192
-
193
-
194
-
195
-
196
-
197
-
198
-
199
-
200
-
201
-
202
-
203
-
204
-
205
-
206
-
207
-
208
-
209
-
210
-
211
-
212
-
213
-
214
-
215
-
216
-
217
-
218
-
219
-
220
-
221
-
222
-
223
-
224
-
225
-
226
-
227
-
228
-
229
-
230
-
231
-
232
-
233
-
234
-
235
-
236
-
237
-
238
-
239
-
240
-
241
-
242
-
243
-
244
-
245
-
246
-
247
-
248
-
249
-
250
-
251
-
252
-
253
-
254
-
255
-
256
-
257
-
258
-
259
-
260
-
261
-
262
-
263
-
264
-
265
-
266
-
267
-
268
-
269
-
270
-
271
-
272
-
273
-
274
-
275
-
276
-
277
-
278
-
279
-
280
-
281
-
282
-
283
-
284
-
285
-
286
-
287
-
288
-
289
-
290
-
291
-
292
-
293
-
294
-
295
-
296
-
297
-
298
-
299
-
300
-
301
-
302
-
303
-
304
-
305
-
306
-
307
-
308
-
309
-
310
-
311
-
312
-
313
-
314
-
315
-
316
-
317
-
318
-
319
-
320
-
321
-
322
-
323
-
324
-
325
-
326
-
327
-
328
-
329
-
330
-
331
-
332
 |
 |

91
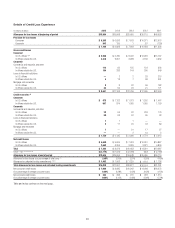
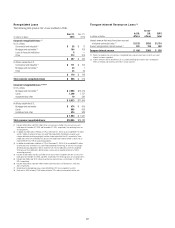
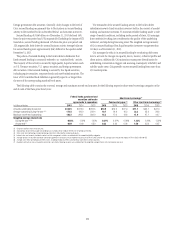
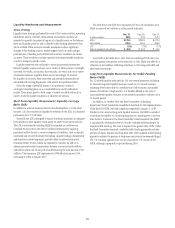
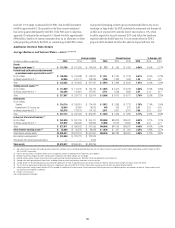
Long-Term Debt Issuances and Maturities
The table below details Citi’s long-term debt issuances and maturities (including repurchases and redemptions) during the periods presented:
2015 2014 2013
In billions of dollars Maturities Issuances Maturities Issuances Maturities Issuances
Parent
Benchmark debt:
Senior debt $23.9 $20.2 $18.9 $18.6 $ 25.6 $17.8
Subordinated debt 4.0 7.5 5.0 2.8 1.0 4.6
Trust preferred — — 2.1 — 6.4 —
Customer-related debt:
Structured debt 7.7 9.1 7.5 9.5 8.5 7.3
Non-structured debt 2.2 0.4 2.4 1.4 3.7 1.0
Local country and other 0.4 1.9 2.4 3.7 0.8 —
Total parent $38.2 $39.1 $38.3 $36.0 $ 46.0 $30.7
Bank
FHLB borrowings $ 4.0 $ 2.0 $ 8.0 $13.9 $ 11.8 $ 9.5
Securitizations 7.9 0.8 8.9 13.6 2.4 11.5
Local country and other 2.8 2.7 3.7 3.3 3.6 2.7
Total bank $14.7 $ 5.5 $20.6 $30.8 $ 17.8 $23.7
Total $52.9 $44.6 $58.9 $66.8 $ 63.8 $54.4
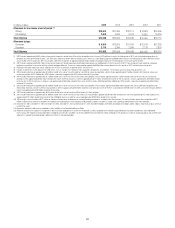
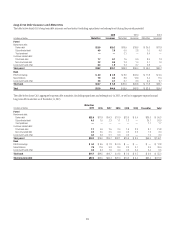
The table below shows Citi’s aggregate long-term debt maturities (including repurchases and redemptions) in 2015, as well as its aggregate expected annual
long-term debt maturities as of December 31, 2015:
In billions of dollars
Maturities
2015 2016 2017 2018 2019 2020 Thereafter Total
Parent
Benchmark debt:
Senior debt $23.9 $11.8 $14.3 $17.9 $13.6 $ 6.4 $26.3 $ 90.3
Subordinated debt 4.0 1.5 2.3 1.1 1.3 — 20.7 26.9
Trust preferred —— — — — — 1.7 1.7
Customer-related debt:
Structured debt 7.7 4.9 2.5 2.4 1.6 2.3 8.1 21.8
Non-structured debt 2.2 0.5 0.5 0.4 0.2 0.2 1.2 3.0
Local country and other 0.4 0.3 0.1 0.3 0.2 — 1.5 2.4
Total parent $38.2 $19.0 $19.7 $22.1 $16.9 $ 8.9 $59.5 $ 146.1
Bank
FHLB borrowings $ 4.0 $ 9.5 $ 7.8 $ 0.5 $ — $ — $ — $ 17.8
Securitizations 7.9 11.6 5.3 8.4 2.0 0.1 3.5 30.9
Local country and other 2.8 3.4 1.6 0.4 0.3 0.4 0.4 6.5
Total bank $14.7 $24.5 $14.7 $ 9.3 $ 2.3 $ 0.5 $ 3.9 $ 55.2
Total long-term debt $52.9 $43.5 $34.4 $31.4 $19.2 $ 9.4 $63.4 $ 201.3