Citibank 2015 Annual Report Download - page 250
Download and view the complete annual report
Please find page 250 of the 2015 Citibank annual report below. You can navigate through the pages in the report by either clicking on the pages listed below, or by using the keyword search tool below to find specific information within the annual report.-
 1
1 -
2
-
3
-
4
-
5
-
6
-
7
-
8
-
9
-
10
-
11
-
12
-
13
-
14
-
15
-
16
-
17
-
18
-
19
-
20
-
21
-
22
-
23
-
24
-
25
-
26
-
27
-
28
-
29
-
30
-
31
-
32
-
33
-
34
-
35
-
36
-
37
-
38
-
39
-
40
-
41
-
42
-
43
-
44
-
45
-
46
-
47
-
48
-
49
-
50
-
51
-
52
-
53
-
54
-
55
-
56
-
57
-
58
-
59
-
60
-
61
-
62
-
63
-
64
-
65
-
66
-
67
-
68
-
69
-
70
-
71
-
72
-
73
-
74
-
75
-
76
-
77
-
78
-
79
-
80
-
81
-
82
-
83
-
84
-
85
-
86
-
87
-
88
-
89
-
90
-
91
-
92
-
93
-
94
-
95
-
96
-
97
-
98
-
99
-
100
-
101
-
102
-
103
-
104
-
105
-
106
-
107
-
108
-
109
-
110
-
111
-
112
-
113
-
114
-
115
-
116
-
117
-
118
-
119
-
120
-
121
-
122
-
123
-
124
-
125
-
126
-
127
-
128
-
129
-
130
-
131
-
132
-
133
-
134
-
135
-
136
-
137
-
138
-
139
-
140
-
141
-
142
-
143
-
144
-
145
-
146
-
147
-
148
-
149
-
150
-
151
-
152
-
153
-
154
-
155
-
156
-
157
-
158
-
159
-
160
-
161
-
162
-
163
-
164
-
165
-
166
-
167
-
168
-
169
-
170
-
171
-
172
-
173
-
174
-
175
-
176
-
177
-
178
-
179
-
180
-
181
-
182
-
183
-
184
-
185
-
186
-
187
-
188
-
189
-
190
-
191
-
192
-
193
-
194
-
195
-
196
-
197
-
198
-
199
-
200
-
201
-
202
-
203
-
204
-
205
-
206
-
207
-
208
-
209
-
210
-
211
-
212
-
213
-
214
-
215
-
216
-
217
-
218
-
219
-
220
-
221
-
222
-
223
-
224
-
225
-
226
-
227
-
228
-
229
-
230
-
231
-
232
-
233
-
234
-
235
-
236
-
237
-
238
-
239
-
 240
240 -
 241
241 -
 242
242 -
 243
243 -
 244
244 -
 245
245 -
 246
246 -
 247
247 -
 248
248 -
 249
249 -
 250
250 -
 251
251 -
 252
252 -
 253
253 -
 254
254 -
 255
255 -
 256
256 -
 257
257 -
 258
258 -
 259
259 -
 260
260 -
261
-
262
-
263
-
264
-
265
-
266
-
267
-
268
-
269
-
270
-
271
-
272
-
273
-
274
-
275
-
276
-
277
-
278
-
279
-
280
-
281
-
282
-
283
-
284
-
285
-
286
-
287
-
288
-
289
-
290
-
291
-
292
-
293
-
294
-
295
-
296
-
297
-
298
-
299
-
300
-
301
-
302
-
303
-
304
-
305
-
306
-
307
-
308
-
309
-
310
-
311
-
312
-
313
-
314
-
315
-
316
-
317
-
318
-
319
-
320
-
321
-
322
-
323
-
324
-
325
-
326
-
327
-
328
-
329
-
330
-
331
-
332
 |
 |

232
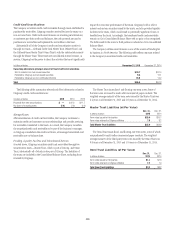
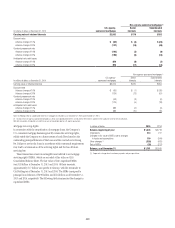
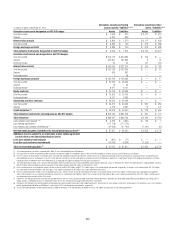
Key Assumptions and Retained Interests
The key assumptions used to value retained interests in CLOs, and the
sensitivity of the fair value to adverse changes of 10% and 20% are set forth in
the tables below:
Dec. 31, 2015 Dec. 31, 2014
Discount rate 1.4% to 49.6% 1.4% to 49.2%
In millions of dollars Dec. 31, 2015 Dec. 31, 2014
Carrying value of retained interests $918 $1,555
Discount rates
Adverse change of 10% $ (5) $ (10)
Adverse change of 20% (10) (20)
Asset-Based Financing
The Company provides loans and other forms of financing to VIEs that hold
assets. Those loans are subject to the same credit approvals as all other loans
originated or purchased by the Company. Financings in the form of debt
securities or derivatives are, in most circumstances, reported in Trading
account assets and accounted for at fair value through earnings. The
Company generally does not have the power to direct the activities that most
significantly impact these VIEs’ economic performance, and thus it does not
consolidate them.
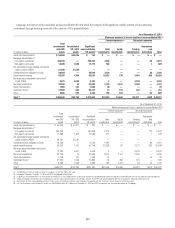
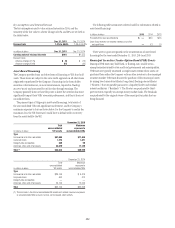
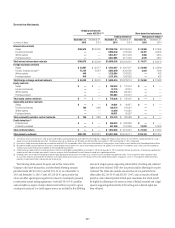
The primary types of Citigroup’s asset-based financings, total assets of
the unconsolidated VIEs with significant involvement, and the Company’s
maximum exposure to loss are shown below. For the Company to realize the
maximum loss, the VIE (borrower) would have to default with no recovery
from the assets held by the VIE.
December 31, 2015
In millions of dollars
Total
unconsolidated
VIE assets
Maximum
exposure to
unconsolidated VIEs
Type
Commercial and other real estate $41,695 $11,454
Corporate loans 1,274 1,871
Hedge funds and equities 385 55
Airplanes, ships and other assets 38,679 17,140
Total (1) $82,033 $30,520
December 31, 2014
In millions of dollars
Total
unconsolidated
VIE assets
Maximum
exposure to
unconsolidated VIEs
Type
Commercial and other real estate $26,146 $ 9,476
Corporate loans 460 473
Hedge funds and equities — —
Airplanes, ships and other assets 36,143 15,649
Total $62,749 $25,598
(1) The increase in the total unconsolidated VIE assets and related maximum exposure
to unconsolidated VIEs is due to normal, yet increased, client activity.
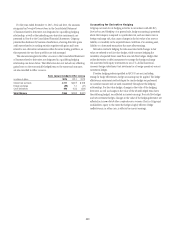
The following table summarizes selected cash flow information related to
asset-based financings:
In billions of dollars 2015 2014 2013
Proceeds from new securitizations $ — $0.5 $0.5
Cash flows received on retained interests and other
net cash flows —0.3 1.0
There were no gains recognized on the securitizations of asset-based
financings for the years ended December 31, 2015, 2014 and 2013.
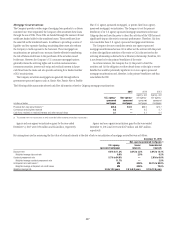
Municipal Securities Tender Option Bond (TOB) Trusts
Municipal TOB trusts may hold fixed- or floating-rate, taxable or tax-
exempt securities issued by state and local governments and municipalities.
TOB trusts are typically structured as single-issuer entities whose assets are
purchased from either the Company or from other investors in the municipal
securities market. TOB trusts finance the purchase of their municipal assets
by issuing two classes of certificates: long-dated, floating rate certificates
(“Floaters”) that are putable pursuant to a liquidity facility and residual
interest certificates (“Residuals”). The Floaters are purchased by third-
party investors, typically tax-exempt money market funds. The Residuals
are purchased by the original owner of the municipal securities that are
being financed.