Citibank 2015 Annual Report Download - page 202
Download and view the complete annual report
Please find page 202 of the 2015 Citibank annual report below. You can navigate through the pages in the report by either clicking on the pages listed below, or by using the keyword search tool below to find specific information within the annual report.-
 1
1 -
2
-
3
-
4
-
5
-
6
-
7
-
8
-
9
-
10
-
11
-
12
-
13
-
14
-
15
-
16
-
17
-
18
-
19
-
20
-
21
-
22
-
23
-
24
-
25
-
26
-
27
-
28
-
29
-
30
-
31
-
32
-
33
-
34
-
35
-
36
-
37
-
38
-
39
-
40
-
41
-
42
-
43
-
44
-
45
-
46
-
47
-
48
-
49
-
50
-
51
-
52
-
53
-
54
-
55
-
56
-
57
-
58
-
59
-
60
-
61
-
62
-
63
-
64
-
65
-
66
-
67
-
68
-
69
-
70
-
71
-
72
-
73
-
74
-
75
-
76
-
77
-
78
-
79
-
80
-
81
-
82
-
83
-
84
-
85
-
86
-
87
-
88
-
89
-
90
-
91
-
92
-
93
-
94
-
95
-
96
-
97
-
98
-
99
-
100
-
101
-
102
-
103
-
104
-
105
-
106
-
107
-
108
-
109
-
110
-
111
-
112
-
113
-
114
-
115
-
116
-
117
-
118
-
119
-
120
-
121
-
122
-
123
-
124
-
125
-
126
-
127
-
128
-
129
-
130
-
131
-
132
-
133
-
134
-
135
-
136
-
137
-
138
-
139
-
140
-
141
-
142
-
143
-
144
-
145
-
146
-
147
-
148
-
149
-
150
-
151
-
152
-
153
-
154
-
155
-
156
-
157
-
158
-
159
-
160
-
161
-
162
-
163
-
164
-
165
-
166
-
167
-
168
-
169
-
170
-
171
-
172
-
173
-
174
-
175
-
176
-
177
-
178
-
179
-
180
-
181
-
182
-
183
-
184
-
185
-
186
-
187
-
188
-
189
-
190
-
191
-
 192
192 -
 193
193 -
 194
194 -
 195
195 -
 196
196 -
 197
197 -
 198
198 -
 199
199 -
 200
200 -
 201
201 -
 202
202 -
 203
203 -
 204
204 -
 205
205 -
 206
206 -
 207
207 -
 208
208 -
 209
209 -
 210
210 -
 211
211 -
 212
212 -
213
-
214
-
215
-
216
-
217
-
218
-
219
-
220
-
221
-
222
-
223
-
224
-
225
-
226
-
227
-
228
-
229
-
230
-
231
-
232
-
233
-
234
-
235
-
236
-
237
-
238
-
239
-
240
-
241
-
242
-
243
-
244
-
245
-
246
-
247
-
248
-
249
-
250
-
251
-
252
-
253
-
254
-
255
-
256
-
257
-
258
-
259
-
260
-
261
-
262
-
263
-
264
-
265
-
266
-
267
-
268
-
269
-
270
-
271
-
272
-
273
-
274
-
275
-
276
-
277
-
278
-
279
-
280
-
281
-
282
-
283
-
284
-
285
-
286
-
287
-
288
-
289
-
290
-
291
-
292
-
293
-
294
-
295
-
296
-
297
-
298
-
299
-
300
-
301
-
302
-
303
-
304
-
305
-
306
-
307
-
308
-
309
-
310
-
311
-
312
-
313
-
314
-
315
-
316
-
317
-
318
-
319
-
320
-
321
-
322
-
323
-
324
-
325
-
326
-
327
-
328
-
329
-
330
-
331
-
332
 |
 |

184
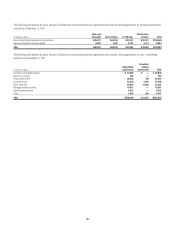
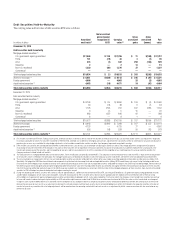
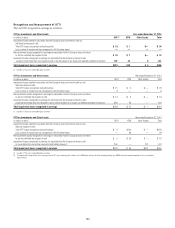
13. TRADING ACCOUNT ASSETS AND LIABILITIES
Trading account assets and Trading account liabilities are carried at fair
value, other than physical commodities accounted for at the lower of cost or
fair value, and consist of the following:
December 31,
In millions of dollars 2015 2014
Trading account assets
Mortgage-backed securities (1)
U.S. government-sponsored agency guaranteed $ 24,767 $ 27,053
Prime 803 1,271
Alt-A 543 709
Subprime 516 1,382
Non-U.S. residential 523 1,476
Commercial 2,855 4,343
Total mortgage-backed securities $ 30,007 $ 36,234
U.S. Treasury and federal agency securities
U.S. Treasury $ 15,791 $ 18,906
Agency obligations 2,005 1,568
Total U.S. Treasury and federal agency securities $ 17,796 $ 20,474
State and municipal securities $ 2,696 $ 3,402
Foreign government securities 56,609 64,937
Corporate 14,437 27,797
Derivatives (2) 56,184 67,957
Equity securities 56,495 57,846
Asset-backed securities (1) 3,956 4,546
Other trading assets (3) 11,776 13,593
Total trading account assets $249,956 $296,786
Trading account liabilities
Securities sold, not yet purchased $ 57,827 $ 70,944
Derivatives (2) 57,592 68,092
Other trading liabilities (3) 2,093 —
Total trading account liabilities $117,512 $139,036
(1) The Company invests in mortgage-backed and asset-backed securities. These securitizations are
generally considered VIEs. The Company’s maximum exposure to loss from these VIEs is equal to
the carrying amount of the securities, which is reflected in the table above. For mortgage-backed
and asset-backed securitizations in which the Company has other involvement, see Note 22 to the
Consolidated Financial Statements.
(2) Presented net, pursuant to enforceable master netting agreements. See Note 23 to the Consolidated
Financial Statements for a discussion regarding the accounting and reporting for derivatives.
(3) Includes positions related to investments in unallocated precious metals, as discussed in Note 26 to
the Consolidated Financial Statements. Also includes physical commodities accounted for at the lower
of cost or fair value.