Citibank 2015 Annual Report Download - page 107
Download and view the complete annual report
Please find page 107 of the 2015 Citibank annual report below. You can navigate through the pages in the report by either clicking on the pages listed below, or by using the keyword search tool below to find specific information within the annual report.-
 1
1 -
2
-
3
-
4
-
5
-
6
-
7
-
8
-
9
-
10
-
11
-
12
-
13
-
14
-
15
-
16
-
17
-
18
-
19
-
20
-
21
-
22
-
23
-
24
-
25
-
26
-
27
-
28
-
29
-
30
-
31
-
32
-
33
-
34
-
35
-
36
-
37
-
38
-
39
-
40
-
41
-
42
-
43
-
44
-
45
-
46
-
47
-
48
-
49
-
50
-
51
-
52
-
53
-
54
-
55
-
56
-
57
-
58
-
59
-
60
-
61
-
62
-
63
-
64
-
65
-
66
-
67
-
68
-
69
-
70
-
71
-
72
-
73
-
74
-
75
-
76
-
77
-
78
-
79
-
80
-
81
-
82
-
83
-
84
-
85
-
86
-
87
-
88
-
89
-
90
-
91
-
92
-
93
-
94
-
95
-
96
-
 97
97 -
 98
98 -
 99
99 -
 100
100 -
 101
101 -
 102
102 -
 103
103 -
 104
104 -
 105
105 -
 106
106 -
 107
107 -
 108
108 -
 109
109 -
 110
110 -
 111
111 -
 112
112 -
 113
113 -
 114
114 -
 115
115 -
 116
116 -
 117
117 -
118
-
119
-
120
-
121
-
122
-
123
-
124
-
125
-
126
-
127
-
128
-
129
-
130
-
131
-
132
-
133
-
134
-
135
-
136
-
137
-
138
-
139
-
140
-
141
-
142
-
143
-
144
-
145
-
146
-
147
-
148
-
149
-
150
-
151
-
152
-
153
-
154
-
155
-
156
-
157
-
158
-
159
-
160
-
161
-
162
-
163
-
164
-
165
-
166
-
167
-
168
-
169
-
170
-
171
-
172
-
173
-
174
-
175
-
176
-
177
-
178
-
179
-
180
-
181
-
182
-
183
-
184
-
185
-
186
-
187
-
188
-
189
-
190
-
191
-
192
-
193
-
194
-
195
-
196
-
197
-
198
-
199
-
200
-
201
-
202
-
203
-
204
-
205
-
206
-
207
-
208
-
209
-
210
-
211
-
212
-
213
-
214
-
215
-
216
-
217
-
218
-
219
-
220
-
221
-
222
-
223
-
224
-
225
-
226
-
227
-
228
-
229
-
230
-
231
-
232
-
233
-
234
-
235
-
236
-
237
-
238
-
239
-
240
-
241
-
242
-
243
-
244
-
245
-
246
-
247
-
248
-
249
-
250
-
251
-
252
-
253
-
254
-
255
-
256
-
257
-
258
-
259
-
260
-
261
-
262
-
263
-
264
-
265
-
266
-
267
-
268
-
269
-
270
-
271
-
272
-
273
-
274
-
275
-
276
-
277
-
278
-
279
-
280
-
281
-
282
-
283
-
284
-
285
-
286
-
287
-
288
-
289
-
290
-
291
-
292
-
293
-
294
-
295
-
296
-
297
-
298
-
299
-
300
-
301
-
302
-
303
-
304
-
305
-
306
-
307
-
308
-
309
-
310
-
311
-
312
-
313
-
314
-
315
-
316
-
317
-
318
-
319
-
320
-
321
-
322
-
323
-
324
-
325
-
326
-
327
-
328
-
329
-
330
-
331
-
332
 |
 |

89
As set forth in the table above, Citi’s HQLA decreased both year-over-year
as well as sequentially, driven primarily by reductions in long-term debt
and short-term borrowings, as discussed further under “Secured Funding
Transactions and Short-Term Borrowings” below.
Citi’s HQLA as set forth above does not include Citi’s available borrowing
capacity from the Federal Home Loan Banks (FHLB) of which Citi is a
member, which was approximately $36 billion as of December 31, 2015
(unchanged from September 30, 2015 and compared to $26 billion as of
December 31, 2014) and maintained by eligible collateral pledged to such
banks. The HQLA also does not include Citi’s borrowing capacity at the U.S.
Federal Reserve Bank discount window or other central banks, which would
be in addition to the resources noted above.
In general, Citi’s liquidity is fungible across legal entities within its
bank group. Citi’s bank subsidiaries, including Citibank, can lend to the
Citi parent and broker-dealer entities in accordance with Section 23A of
the Federal Reserve Act. As of December 31, 2015, the capacity available for
lending to these entities under Section 23A was approximately $17 billion,
largely unchanged from prior periods, subject to certain eligible non-cash
collateral requirements.
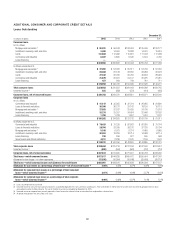
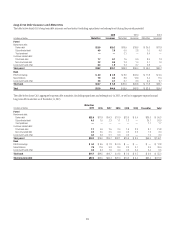
Loans
As part of its funding and liquidity objectives, Citi seeks to fund its existing
asset base appropriately as well as maintain sufficient liquidity to grow its
core businesses in Citicorp, including its loan portfolio. Citi maintains a
diversified portfolio of loans to its consumer and institutional clients. The
table below sets forth the end-of-period loans, by business and/or segment,
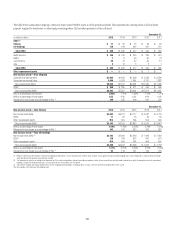
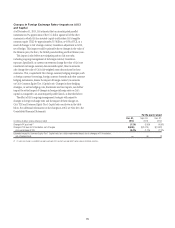
and the total average loans for each of the periods indicated:
In billions of dollars
Dec. 31,
2015
Sept. 30,
2015
Dec. 31,
2014
Global Consumer Banking
North America $165.1 $158.5 $160.8
Latin America 31.5 31.4 35.5
Asia (1) 88.7 88.4 94.8
Total $285.3 $278.3 $291.1
Institutional Clients Group
Corporate lending 114.9 116.5 108.4
Treasury and trade solutions (TTS) 71.3 73.4 76.0
Private bank, markets and securities services
and other 101.3 98.9 89.9
Total $287.5 $288.8 $274.3
Total Citicorp 572.8 567.1 565.4
Total Citi Holdings 44.8 55.3 79.2
Total Citigroup loans (EOP) $617.6 $622.4 $644.6
Total Citigroup loans (AVG) $625.1 $623.2 $650.8
(1) For reporting purposes, includes EMEA GCB for all periods presented.
End-of-period loans declined 4% year-over-year and 1% quarter-over-
quarter. Excluding the impact of FX translation, Citigroup’s end-of-period
loans decreased 1% both year-over-year and sequentially, in each case driven
by continued overall declines in Citi Holdings.
Excluding the impact of FX translation, Citicorp loans increased 5%
year-over-year. GCB loans grew 2% year-over-year, driven by 3% growth in
North America. ICG loans increased 8% year-over-year. Within ICG, corporate
loans increased 9% driven by both new business and the funding of prior
commitments. Treasury and trade solutions loans declined 3%, as Citi
continued to distribute a significant portion of its trade loan originations,
which allows it to support its clients while maintaining balance sheet
discipline in a continued low spread environment. Private bank, markets and
securities services and other loans grew 14% year-over-year.
Citi Holdings loans decreased 43% year-over-year driven by over $21
billion of reductions in North America mortgages, including transfers to
held-for-sale (see Note 15 to the Consolidated Financial Statements), as well
as the sale of OneMain Financial, which was completed during the fourth
quarter of 2015.
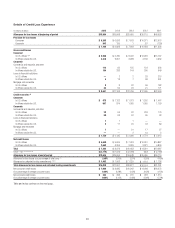
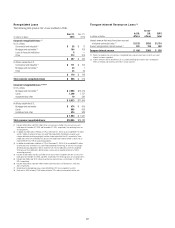
Deposits
Deposits are Citi’s primary and lowest cost funding source. The table below
sets forth the end-of-period deposits, by business and/or segment, and the
total average deposits for each of the periods indicated:
In billions of dollars
Dec. 31,
2015
Sept. 30,
2015
Dec. 31,
2014
Global Consumer Banking
North America $172.8 $170.9 $171.4
Latin America 40.8 38.8 43.7
Asia (1) 87.8 87.1 89.2
Total $301.4 $296.8 $304.3
Institutional Clients Group
Treasury and trade solutions (TTS) 392.2 398.7 378.0
Banking ex-TTS 118.8 117.4 94.5
Markets and securities services 76.3 78.8 82.9
Total $587.3 $594.9 $555.4
Corporate/Other 12.1 5.4 22.8
Total Citicorp $900.8 $897.1 $882.5
Total Citi Holdings 7.1 7.1 16.8
Total Citigroup deposits (EOP) $907.9 $904.2 $899.3
Total Citigroup deposits (AVG) $908.8 $903.1 $938.7
(1) For reporting purposes, includes EMEA GCB for all periods presented.