Citibank 2015 Annual Report Download - page 314
Download and view the complete annual report
Please find page 314 of the 2015 Citibank annual report below. You can navigate through the pages in the report by either clicking on the pages listed below, or by using the keyword search tool below to find specific information within the annual report.-
 1
1 -
2
-
3
-
4
-
5
-
6
-
7
-
8
-
9
-
10
-
11
-
12
-
13
-
14
-
15
-
16
-
17
-
18
-
19
-
20
-
21
-
22
-
23
-
24
-
25
-
26
-
27
-
28
-
29
-
30
-
31
-
32
-
33
-
34
-
35
-
36
-
37
-
38
-
39
-
40
-
41
-
42
-
43
-
44
-
45
-
46
-
47
-
48
-
49
-
50
-
51
-
52
-
53
-
54
-
55
-
56
-
57
-
58
-
59
-
60
-
61
-
62
-
63
-
64
-
65
-
66
-
67
-
68
-
69
-
70
-
71
-
72
-
73
-
74
-
75
-
76
-
77
-
78
-
79
-
80
-
81
-
82
-
83
-
84
-
85
-
86
-
87
-
88
-
89
-
90
-
91
-
92
-
93
-
94
-
95
-
96
-
97
-
98
-
99
-
100
-
101
-
102
-
103
-
104
-
105
-
106
-
107
-
108
-
109
-
110
-
111
-
112
-
113
-
114
-
115
-
116
-
117
-
118
-
119
-
120
-
121
-
122
-
123
-
124
-
125
-
126
-
127
-
128
-
129
-
130
-
131
-
132
-
133
-
134
-
135
-
136
-
137
-
138
-
139
-
140
-
141
-
142
-
143
-
144
-
145
-
146
-
147
-
148
-
149
-
150
-
151
-
152
-
153
-
154
-
155
-
156
-
157
-
158
-
159
-
160
-
161
-
162
-
163
-
164
-
165
-
166
-
167
-
168
-
169
-
170
-
171
-
172
-
173
-
174
-
175
-
176
-
177
-
178
-
179
-
180
-
181
-
182
-
183
-
184
-
185
-
186
-
187
-
188
-
189
-
190
-
191
-
192
-
193
-
194
-
195
-
196
-
197
-
198
-
199
-
200
-
201
-
202
-
203
-
204
-
205
-
206
-
207
-
208
-
209
-
210
-
211
-
212
-
213
-
214
-
215
-
216
-
217
-
218
-
219
-
220
-
221
-
222
-
223
-
224
-
225
-
226
-
227
-
228
-
229
-
230
-
231
-
232
-
233
-
234
-
235
-
236
-
237
-
238
-
239
-
240
-
241
-
242
-
243
-
244
-
245
-
246
-
247
-
248
-
249
-
250
-
251
-
252
-
253
-
254
-
255
-
256
-
257
-
258
-
259
-
260
-
261
-
262
-
263
-
264
-
265
-
266
-
267
-
268
-
269
-
270
-
271
-
272
-
273
-
274
-
275
-
276
-
277
-
278
-
279
-
280
-
281
-
282
-
283
-
284
-
285
-
286
-
287
-
288
-
289
-
290
-
291
-
292
-
293
-
294
-
295
-
296
-
297
-
298
-
299
-
300
-
301
-
302
-
303
-
 304
304 -
 305
305 -
 306
306 -
 307
307 -
 308
308 -
 309
309 -
 310
310 -
 311
311 -
 312
312 -
 313
313 -
 314
314 -
 315
315 -
 316
316 -
 317
317 -
 318
318 -
 319
319 -
 320
320 -
 321
321 -
 322
322 -
 323
323 -
 324
324 -
325
-
326
-
327
-
328
-
329
-
330
-
331
-
332
 |
 |

296
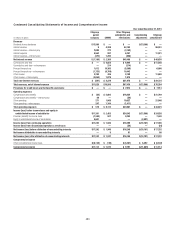
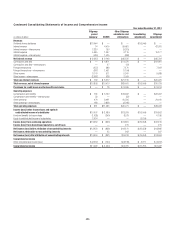
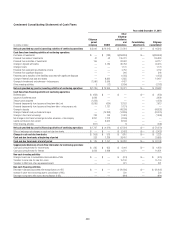
Condensed Consolidating Statements of Income and Comprehensive Income
Year ended December 31, 2013
In millions of dollars
Citigroup
parent
company CGMHI
Other Citigroup
subsidiaries and
eliminations
Consolidating
adjustments
Citigroup
consolidated
Revenues
Dividends from subsidiaries $13,044 $ — $ — $(13,044) $ —
Interest revenue 14 4,475 58,481 — 62,970
Interest revenue—intercompany 3,220 159 (3,379) — —
Interest expense 5,995 1,067 9,115 — 16,177
Interest expense—intercompany (436) 1,425 (989) — —
Net interest revenue $ (2,325) $ 2,142 $46,976 $ — $46,793
Commissions and fees $ — $ 4,871 $ 8,070 $ — $12,941
Commissions and fees—intercompany — 27 (27) — —
Principal transactions (257) 389 7,170 — 7,302
Principal transactions—intercompany (387) 1,491 (1,104) — —
Other income 3,770 571 5,347 — 9,688
Other income—intercompany (2,987) 928 2,059 — —
Total non-interest revenues $ 139 $ 8,277 $21,515 $ — $29,931
Total revenues, net of interest expense $10,858 $10,419 $68,491 $(13,044) $76,724
Provisions for credit losses and for benefits and claims $ — $ 18 $ 8,496 $ — $ 8,514
Operating expenses
Compensation and benefits $ 136 $ 5,169 $18,662 $ — $23,967
Compensation and benefits—intercompany 52 — (52) — —
Other operating 474 3,461 20,506 — 24,441
Other operating—intercompany 189 2,856 (3,045) — —
Total operating expenses $ 851 $11,486 $36,071 $ — $48,408
Income (loss) before income taxes and equity in
undistributed income of subsidiaries $10,007 $ (1,085) $23,924 $(13,044) $19,802
Provision (benefit) for income taxes (1,638) (249) 8,073 — 6,186
Equity in undistributed income of subsidiaries 2,014 — — (2,014) —
Income (loss) from continuing operations $13,659 $ (836) $15,851 $(15,058) $13,616
Income (loss) from discontinued operations, net of taxes — — 270 — 270
Net income (loss) before attribution of noncontrolling interests $13,659 $ (836) $16,121 $(15,058) $13,886
Net income attributable to noncontrolling interests — 25 202 — 227
Net income (loss) after attribution of noncontrolling interests $13,659 $ (861) $15,919 $(15,058) $13,659
Comprehensive income
Other comprehensive income (loss) $ (2,237) $ (139) $ (3,138) $ 3,277 $ (2,237)
Comprehensive income $11,422 $ (1,000) $12,781 $(11,781) $11,422