Citibank 2015 Annual Report Download - page 264
Download and view the complete annual report
Please find page 264 of the 2015 Citibank annual report below. You can navigate through the pages in the report by either clicking on the pages listed below, or by using the keyword search tool below to find specific information within the annual report.-
 1
1 -
2
-
3
-
4
-
5
-
6
-
7
-
8
-
9
-
10
-
11
-
12
-
13
-
14
-
15
-
16
-
17
-
18
-
19
-
20
-
21
-
22
-
23
-
24
-
25
-
26
-
27
-
28
-
29
-
30
-
31
-
32
-
33
-
34
-
35
-
36
-
37
-
38
-
39
-
40
-
41
-
42
-
43
-
44
-
45
-
46
-
47
-
48
-
49
-
50
-
51
-
52
-
53
-
54
-
55
-
56
-
57
-
58
-
59
-
60
-
61
-
62
-
63
-
64
-
65
-
66
-
67
-
68
-
69
-
70
-
71
-
72
-
73
-
74
-
75
-
76
-
77
-
78
-
79
-
80
-
81
-
82
-
83
-
84
-
85
-
86
-
87
-
88
-
89
-
90
-
91
-
92
-
93
-
94
-
95
-
96
-
97
-
98
-
99
-
100
-
101
-
102
-
103
-
104
-
105
-
106
-
107
-
108
-
109
-
110
-
111
-
112
-
113
-
114
-
115
-
116
-
117
-
118
-
119
-
120
-
121
-
122
-
123
-
124
-
125
-
126
-
127
-
128
-
129
-
130
-
131
-
132
-
133
-
134
-
135
-
136
-
137
-
138
-
139
-
140
-
141
-
142
-
143
-
144
-
145
-
146
-
147
-
148
-
149
-
150
-
151
-
152
-
153
-
154
-
155
-
156
-
157
-
158
-
159
-
160
-
161
-
162
-
163
-
164
-
165
-
166
-
167
-
168
-
169
-
170
-
171
-
172
-
173
-
174
-
175
-
176
-
177
-
178
-
179
-
180
-
181
-
182
-
183
-
184
-
185
-
186
-
187
-
188
-
189
-
190
-
191
-
192
-
193
-
194
-
195
-
196
-
197
-
198
-
199
-
200
-
201
-
202
-
203
-
204
-
205
-
206
-
207
-
208
-
209
-
210
-
211
-
212
-
213
-
214
-
215
-
216
-
217
-
218
-
219
-
220
-
221
-
222
-
223
-
224
-
225
-
226
-
227
-
228
-
229
-
230
-
231
-
232
-
233
-
234
-
235
-
236
-
237
-
238
-
239
-
240
-
241
-
242
-
243
-
244
-
245
-
246
-
247
-
248
-
249
-
250
-
251
-
252
-
253
-
 254
254 -
 255
255 -
 256
256 -
 257
257 -
 258
258 -
 259
259 -
 260
260 -
 261
261 -
 262
262 -
 263
263 -
 264
264 -
 265
265 -
 266
266 -
 267
267 -
 268
268 -
 269
269 -
 270
270 -
 271
271 -
 272
272 -
 273
273 -
 274
274 -
275
-
276
-
277
-
278
-
279
-
280
-
281
-
282
-
283
-
284
-
285
-
286
-
287
-
288
-
289
-
290
-
291
-
292
-
293
-
294
-
295
-
296
-
297
-
298
-
299
-
300
-
301
-
302
-
303
-
304
-
305
-
306
-
307
-
308
-
309
-
310
-
311
-
312
-
313
-
314
-
315
-
316
-
317
-
318
-
319
-
320
-
321
-
322
-
323
-
324
-
325
-
326
-
327
-
328
-
329
-
330
-
331
-
332
 |
 |
246
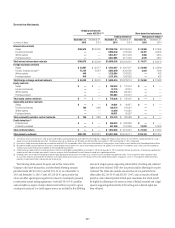
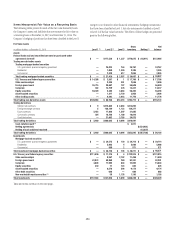
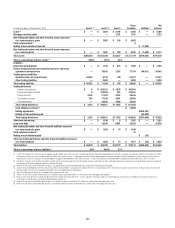
Fair values included in the above tables are prior to application of any
netting agreements and cash collateral. For notional amounts, Citi generally
has a mismatch between the total notional amounts of protection purchased
and sold, and it may hold the reference assets directly, rather than entering
into offsetting credit derivative contracts as and when desired. The open risk
exposures from credit derivative contracts are largely matched after certain
cash positions in reference assets are considered and after notional amounts
are adjusted, either to a duration-based equivalent basis or to reflect the level
of subordination in tranched structures. The ratings of the credit derivatives
portfolio presented in the tables and used to evaluate payment/performance
risk are based on the assigned internal or external ratings of the referenced
asset or entity. Where external ratings are used, investment-grade ratings are
considered to be ‘Baa/BBB’ and above, while anything below is considered
non-investment grade. Citi’s internal ratings are in line with the related
external rating system.
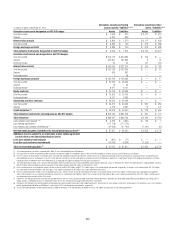
Citigroup evaluates the payment/performance risk of the credit derivatives
for which it stands as a protection seller based on the credit rating assigned to
the underlying referenced credit. Credit derivatives written on an underlying
non-investment grade reference credit represent greater payment risk to
the Company. The non-investment grade category in the table above also
includes credit derivatives where the underlying referenced entity has been
downgraded subsequent to the inception of the derivative.
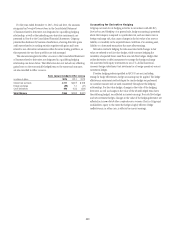
The maximum potential amount of future payments under credit
derivative contracts presented in the table above is based on the notional
value of the derivatives. The Company believes that the notional amount for
credit protection sold is not representative of the actual loss exposure based
on historical experience. This amount has not been reduced by the value
of the reference assets and the related cash flows. In accordance with most
credit derivative contracts, should a credit event occur, the Company usually
is liable for the difference between the protection sold and the value of the
reference assets. Furthermore, the notional amount for credit protection sold
has not been reduced for any cash collateral paid to a given counterparty,
as such payments would be calculated after netting all derivative exposures,
including any credit derivatives with that counterparty in accordance
with a related master netting agreement. Due to such netting processes,
determining the amount of collateral that corresponds to credit derivative
exposures alone is not possible. The Company actively monitors open credit-
risk exposures and manages this exposure by using a variety of strategies,
including purchased credit derivatives, cash collateral or direct holdings
of the referenced assets. This risk mitigation activity is not captured in the
table above.