Citibank 2015 Annual Report Download - page 96
Download and view the complete annual report
Please find page 96 of the 2015 Citibank annual report below. You can navigate through the pages in the report by either clicking on the pages listed below, or by using the keyword search tool below to find specific information within the annual report.-
 1
1 -
2
-
3
-
4
-
5
-
6
-
7
-
8
-
9
-
10
-
11
-
12
-
13
-
14
-
15
-
16
-
17
-
18
-
19
-
20
-
21
-
22
-
23
-
24
-
25
-
26
-
27
-
28
-
29
-
30
-
31
-
32
-
33
-
34
-
35
-
36
-
37
-
38
-
39
-
40
-
41
-
42
-
43
-
44
-
45
-
46
-
47
-
48
-
49
-
50
-
51
-
52
-
53
-
54
-
55
-
56
-
57
-
58
-
59
-
60
-
61
-
62
-
63
-
64
-
65
-
66
-
67
-
68
-
69
-
70
-
71
-
72
-
73
-
74
-
75
-
76
-
77
-
78
-
79
-
80
-
81
-
82
-
83
-
84
-
85
-
 86
86 -
 87
87 -
 88
88 -
 89
89 -
 90
90 -
 91
91 -
 92
92 -
 93
93 -
 94
94 -
 95
95 -
 96
96 -
 97
97 -
 98
98 -
 99
99 -
 100
100 -
 101
101 -
 102
102 -
 103
103 -
 104
104 -
 105
105 -
 106
106 -
107
-
108
-
109
-
110
-
111
-
112
-
113
-
114
-
115
-
116
-
117
-
118
-
119
-
120
-
121
-
122
-
123
-
124
-
125
-
126
-
127
-
128
-
129
-
130
-
131
-
132
-
133
-
134
-
135
-
136
-
137
-
138
-
139
-
140
-
141
-
142
-
143
-
144
-
145
-
146
-
147
-
148
-
149
-
150
-
151
-
152
-
153
-
154
-
155
-
156
-
157
-
158
-
159
-
160
-
161
-
162
-
163
-
164
-
165
-
166
-
167
-
168
-
169
-
170
-
171
-
172
-
173
-
174
-
175
-
176
-
177
-
178
-
179
-
180
-
181
-
182
-
183
-
184
-
185
-
186
-
187
-
188
-
189
-
190
-
191
-
192
-
193
-
194
-
195
-
196
-
197
-
198
-
199
-
200
-
201
-
202
-
203
-
204
-
205
-
206
-
207
-
208
-
209
-
210
-
211
-
212
-
213
-
214
-
215
-
216
-
217
-
218
-
219
-
220
-
221
-
222
-
223
-
224
-
225
-
226
-
227
-
228
-
229
-
230
-
231
-
232
-
233
-
234
-
235
-
236
-
237
-
238
-
239
-
240
-
241
-
242
-
243
-
244
-
245
-
246
-
247
-
248
-
249
-
250
-
251
-
252
-
253
-
254
-
255
-
256
-
257
-
258
-
259
-
260
-
261
-
262
-
263
-
264
-
265
-
266
-
267
-
268
-
269
-
270
-
271
-
272
-
273
-
274
-
275
-
276
-
277
-
278
-
279
-
280
-
281
-
282
-
283
-
284
-
285
-
286
-
287
-
288
-
289
-
290
-
291
-
292
-
293
-
294
-
295
-
296
-
297
-
298
-
299
-
300
-
301
-
302
-
303
-
304
-
305
-
306
-
307
-
308
-
309
-
310
-
311
-
312
-
313
-
314
-
315
-
316
-
317
-
318
-
319
-
320
-
321
-
322
-
323
-
324
-
325
-
326
-
327
-
328
-
329
-
330
-
331
-
332
 |
 |

78
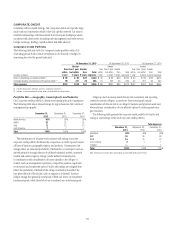
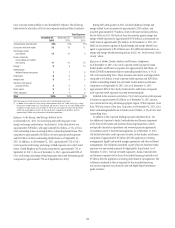
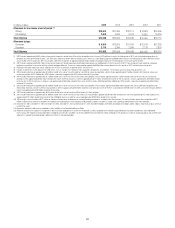
Citi’s corporate credit portfolio is also diversified by industry. The following
table shows the allocation of Citi’s total corporate credit portfolio by industry:
Total Exposure
December 31,
2015
September 30,
2015
December 31,
2014
Transportation and industrial 20% 21% 21%
Consumer retail and health 16 16 17
Technology, media
and telecom 12 10 9
Power, chemicals,
commodities and metals
and mining 11 10 10
Energy (1) 99 10
Banks/broker-
dealers/finance companies 77 8
Real estate 66 6
Hedge funds 56 5
Insurance and special
purpose entities 56 5
Public sector 55 5
Other industries 44 4
Total 100% 100% 100%
Note: Total exposure includes direct outstandings and unfunded lending commitments.
(1) In addition to this exposure, Citi has energy-related exposure within the “Public sector” (e.g., energy-
related state-owned entities) and “Transportation and industrial” sector (e.g., off-shore drilling entities)
included in the table above. As of December 31, 2015, Citi’s total exposure to these energy-related
entities remained largely consistent with the prior quarter, at approximately $6 billion, of which
approximately $4 billion consisted of direct outstanding funded loans.
Exposure to the Energy and Energy-Related Sector
As of December 31, 2015, Citi’s total corporate credit exposure to the
energy and energy-related sector (see footnote 1 to the table above) was
approximately $58 billion, with approximately $21 billion, or 3%, of Citi’s
total outstanding loans consisting of direct outstanding funded loans. This
compared to approximately $61 billion of total corporate credit exposure
and $21 billion of direct outstanding funded loans as of September 30,
2015. In addition, as of December 31, 2015, approximately 72% of Citi’s
total corporate credit energy and energy-related exposure was in the United
States, United Kingdom and Canada (compared to approximately 73% at
September 30, 2015). Also as of December 31, 2015, approximately 80% of
Citi’s total energy and energy-related exposures were rated investment grade
(compared to approximately 79% as of September 30, 2015).
During the fourth quarter of 2015, Citi built additional energy and
energy-related loan loss reserves of approximately $250 million, and
incurred approximately $75 million of net credit losses in these portfolios.
For the full year 2015, Citi built net loan loss reserves against energy and
energy-related exposures by approximately $530 million, and incurred net
credit losses of approximately $95 million. As of December 31, 2015, Citi
held loan loss reserves against its funded energy and energy-related loans
equal to approximately 3.8% of these loans. For additional information on
energy and energy-related reserving actions in ICG, see “Institutional Clients
Group” above.
Exposure to Banks, Broker-Dealers and Finance Companies
As of December 31, 2015, Citi’s total corporate credit exposure to banks,
broker-dealers and finance companies was approximately $42 billion, of
which $29 billion represented direct outstanding funded loans, or 5% of
Citi’s total outstanding loans. These amounts were mostly unchanged when
compared to $43 billion of total corporate credit exposure and $29 billion
of direct outstanding funded loans to banks, broker-dealers and finance
companies as of September 30, 2015. Also as of December 31, 2015,
approximately 84% of Citi’s bank, broker-dealers and finance companies
total corporate credit exposure was rated investment grade.
Included in the amounts noted above, Citi’s total corporate credit exposure
to banks was approximately $26 billion as of December 31, 2015 and was
not concentrated in any particular geographic region. Of this exposure, more
than 70% had a tenor of less than 12 months. As of December 31, 2015, Citi’s
direct outstanding funded loans to banks was $21 billion, or 3% of Citi’s total
outstanding loans.
In addition to the corporate lending exposures described above, Citi
has additional exposure to banks, broker-dealers and finance companies
in the form of derivatives and securities financing transactions, which
are typically executed as repurchase and reverse repurchase agreements
or securities loaned or borrowed arrangements. As of December 31, 2015,
Citi had net derivative credit exposure to banks, broker dealers and finance
companies of approximately $5 billion after the application of netting
arrangements, legally enforceable margin agreements and other collateral
arrangements. The collateral considered as part of the net derivative credit
exposure was represented primarily by high quality, liquid assets. As of
December 31, 2015, Citi had net credit exposure to banks, broker-dealers
and finance companies in the form of securities financing transactions of
$7 billion after the application of netting and collateral arrangements. The
collateral considered in the net exposure for the securities financing
transactions exposure was primarily cash and highly liquid investment
grade securities.