Citibank 2015 Annual Report Download - page 119
Download and view the complete annual report
Please find page 119 of the 2015 Citibank annual report below. You can navigate through the pages in the report by either clicking on the pages listed below, or by using the keyword search tool below to find specific information within the annual report.-
 1
1 -
2
-
3
-
4
-
5
-
6
-
7
-
8
-
9
-
10
-
11
-
12
-
13
-
14
-
15
-
16
-
17
-
18
-
19
-
20
-
21
-
22
-
23
-
24
-
25
-
26
-
27
-
28
-
29
-
30
-
31
-
32
-
33
-
34
-
35
-
36
-
37
-
38
-
39
-
40
-
41
-
42
-
43
-
44
-
45
-
46
-
47
-
48
-
49
-
50
-
51
-
52
-
53
-
54
-
55
-
56
-
57
-
58
-
59
-
60
-
61
-
62
-
63
-
64
-
65
-
66
-
67
-
68
-
69
-
70
-
71
-
72
-
73
-
74
-
75
-
76
-
77
-
78
-
79
-
80
-
81
-
82
-
83
-
84
-
85
-
86
-
87
-
88
-
89
-
90
-
91
-
92
-
93
-
94
-
95
-
96
-
97
-
98
-
99
-
100
-
101
-
102
-
103
-
104
-
105
-
106
-
107
-
108
-
 109
109 -
 110
110 -
 111
111 -
 112
112 -
 113
113 -
 114
114 -
 115
115 -
 116
116 -
 117
117 -
 118
118 -
 119
119 -
 120
120 -
 121
121 -
 122
122 -
 123
123 -
 124
124 -
 125
125 -
 126
126 -
 127
127 -
 128
128 -
 129
129 -
130
-
131
-
132
-
133
-
134
-
135
-
136
-
137
-
138
-
139
-
140
-
141
-
142
-
143
-
144
-
145
-
146
-
147
-
148
-
149
-
150
-
151
-
152
-
153
-
154
-
155
-
156
-
157
-
158
-
159
-
160
-
161
-
162
-
163
-
164
-
165
-
166
-
167
-
168
-
169
-
170
-
171
-
172
-
173
-
174
-
175
-
176
-
177
-
178
-
179
-
180
-
181
-
182
-
183
-
184
-
185
-
186
-
187
-
188
-
189
-
190
-
191
-
192
-
193
-
194
-
195
-
196
-
197
-
198
-
199
-
200
-
201
-
202
-
203
-
204
-
205
-
206
-
207
-
208
-
209
-
210
-
211
-
212
-
213
-
214
-
215
-
216
-
217
-
218
-
219
-
220
-
221
-
222
-
223
-
224
-
225
-
226
-
227
-
228
-
229
-
230
-
231
-
232
-
233
-
234
-
235
-
236
-
237
-
238
-
239
-
240
-
241
-
242
-
243
-
244
-
245
-
246
-
247
-
248
-
249
-
250
-
251
-
252
-
253
-
254
-
255
-
256
-
257
-
258
-
259
-
260
-
261
-
262
-
263
-
264
-
265
-
266
-
267
-
268
-
269
-
270
-
271
-
272
-
273
-
274
-
275
-
276
-
277
-
278
-
279
-
280
-
281
-
282
-
283
-
284
-
285
-
286
-
287
-
288
-
289
-
290
-
291
-
292
-
293
-
294
-
295
-
296
-
297
-
298
-
299
-
300
-
301
-
302
-
303
-
304
-
305
-
306
-
307
-
308
-
309
-
310
-
311
-
312
-
313
-
314
-
315
-
316
-
317
-
318
-
319
-
320
-
321
-
322
-
323
-
324
-
325
-
326
-
327
-
328
-
329
-
330
-
331
-
332
 |
 |

101
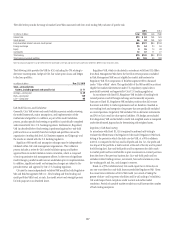
reach the 1.35% target. As discussed by the FDIC, this shortfall assessment
would be approximately 12 basis points on the then-current assessment
base in the quarter determined by the FDIC. If the FDIC were to adopt this
approach, Citi estimates the net impact to Citibank would be approximately
$900 million, based on its current assessment base. As an alternative to either
of the proposals put forth by the FDIC, in commenting on the FDIC’s notice
of proposed rulemaking, industry groups recommended that in lieu of any
surcharge on large banks, the FDIC maintain the assessment rate framework
in effect as of year-end 2015 until the reserve ratio reaches 1.35%, which
would be expected to occur by year-end 2019 (and within the timeframe
required under the Dodd-Frank Act). It is not certain when the FDIC’s
proposal will be finalized and what the ultimate impact will be to Citi.
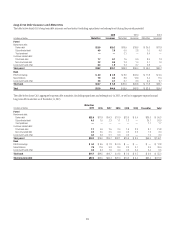
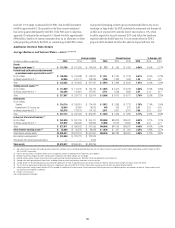
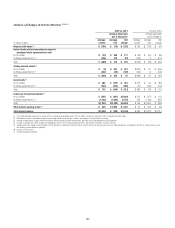
Additional Interest Rate Details
Average Balances and Interest Rates—Assets (1)(2)(3)(4)
Average volume Interest revenue % Average rate
In millions of dollars, except rates 2015 2014 2013 2015 2014 2013 2015 2014 2013
Assets
Deposits with banks (5) $ 133,790 $161,359 $ 144,904 $ 727 $ 959 $ 1,026 0.54% 0.59% 0.71%
Federal funds sold and securities borrowed
or purchased under agreements to resell (6)
In U.S. offices $ 150,359 $ 153,688 $ 158,237 $ 1,211 $ 1,034 $ 1,133 0.81% 0.67% 0.72%
In offices outside the U.S. (5) 84,006 101,177 109,233 1,305 1,332 1,433 1.55 1.32 1.31
Total $ 234,365 $ 254,865 $ 267,470 $ 2,516 $ 2,366 $ 2,566 1.07% 0.93% 0.96%
Trading account assets (7)(8)
In U.S. offices $ 114,639 $ 114,910 $ 126,123 $ 3,945 $ 3,472 $ 3,728 3.44% 3.02% 2.96%
In offices outside the U.S. (5) 103,348 119,801 127,291 2,141 2,538 2,683 2.07 2.12 2.11
Total $ 217,987 $ 234,711 $ 253,414 $ 6,086 $ 6,010 $ 6,411 2.79% 2.56% 2.53%
Investments
In U.S. offices
Taxable $ 214,714 $ 188,910 $ 174,084 $ 3,812 $ 3,286 $ 2,713 1.78% 1.74% 1.56%
Exempt from U.S. income tax 20,034 20,386 18,075 443 626 811 2.21 3.07 4.49
In offices outside the U.S. (5) 102,376 113,163 114,122 3,071 3,627 3,761 3.00 3.21 3.30
Total $ 337,124 $ 322,459 $ 306,281 $ 7,326 $ 7,539 $ 7,285 2.17% 2.34% 2.38%
Loans (net of unearned income) (9)
In U.S. offices $ 354,439 $ 361,769 $ 354,707 $24,558 $26,076 $25,941 6.93% 7.21% 7.31%
In offices outside the U.S. (5) 273,072 296,656 292,852 15,988 18,723 19,660 5.85 6.31 6.71
Total $ 627,511 $ 658,425 $ 647,559 $40,546 $44,799 $45,601 6.46% 6.80% 7.04%
Other interest-earning assets (10) $ 55,060 $ 40,375 $ 38,233 $ 1,839 $ 507 $ 602 3.34% 1.26% 1.57%
Total interest-earning assets $1,605,837 $1,672,194 $1,657,861 $59,040 $62,180 $63,491 3.68% 3.72% 3.83%
Non-interest-earning assets (7) $ 218,000 $ 224,721 $ 222,526
Total assets from discontinued operations —— 2,909
Total assets $1,823,837 $1,896,915 $1,883,296
(1) Net interest revenue includes the taxable equivalent adjustments related to the tax-exempt bond portfolio (based on the U.S. federal statutory tax rate of 35%) of $487 million, $498 million and $521 million for 2015,
2014 and 2013, respectively.
(2) Interest rates and amounts include the effects of risk management activities associated with the respective asset categories.
(3) Monthly or quarterly averages have been used by certain subsidiaries where daily averages are unavailable.
(4) Detailed average volume, Interest revenue and Interest expense exclude Discontinued operations. See Note 2 to the Consolidated Financial Statements.
(5) Average rates reflect prevailing local interest rates, including inflationary effects and monetary corrections in certain countries.
(6) Average volumes of securities borrowed or purchased under agreements to resell are reported net pursuant to ASC 210-20-45. However, Interest revenue excludes the impact of ASC 210-20-45.
(7) The fair value carrying amounts of derivative contracts are reported net, pursuant to ASC 815-10-45, in Non-interest-earning assets and Other non-interest-bearing liabilities.
(8) Interest expense on Trading account liabilities of ICG is reported as a reduction of Interest revenue. Interest revenue and Interest expense on cash collateral positions are reported in interest on Trading account assets
and Trading account liabilities, respectively.
(9) Includes cash-basis loans.
(10) Includes brokerage receivables.