Citibank 2015 Annual Report Download - page 191
Download and view the complete annual report
Please find page 191 of the 2015 Citibank annual report below. You can navigate through the pages in the report by either clicking on the pages listed below, or by using the keyword search tool below to find specific information within the annual report.-
 1
1 -
2
-
3
-
4
-
5
-
6
-
7
-
8
-
9
-
10
-
11
-
12
-
13
-
14
-
15
-
16
-
17
-
18
-
19
-
20
-
21
-
22
-
23
-
24
-
25
-
26
-
27
-
28
-
29
-
30
-
31
-
32
-
33
-
34
-
35
-
36
-
37
-
38
-
39
-
40
-
41
-
42
-
43
-
44
-
45
-
46
-
47
-
48
-
49
-
50
-
51
-
52
-
53
-
54
-
55
-
56
-
57
-
58
-
59
-
60
-
61
-
62
-
63
-
64
-
65
-
66
-
67
-
68
-
69
-
70
-
71
-
72
-
73
-
74
-
75
-
76
-
77
-
78
-
79
-
80
-
81
-
82
-
83
-
84
-
85
-
86
-
87
-
88
-
89
-
90
-
91
-
92
-
93
-
94
-
95
-
96
-
97
-
98
-
99
-
100
-
101
-
102
-
103
-
104
-
105
-
106
-
107
-
108
-
109
-
110
-
111
-
112
-
113
-
114
-
115
-
116
-
117
-
118
-
119
-
120
-
121
-
122
-
123
-
124
-
125
-
126
-
127
-
128
-
129
-
130
-
131
-
132
-
133
-
134
-
135
-
136
-
137
-
138
-
139
-
140
-
141
-
142
-
143
-
144
-
145
-
146
-
147
-
148
-
149
-
150
-
151
-
152
-
153
-
154
-
155
-
156
-
157
-
158
-
159
-
160
-
161
-
162
-
163
-
164
-
165
-
166
-
167
-
168
-
169
-
170
-
171
-
172
-
173
-
174
-
175
-
176
-
177
-
178
-
179
-
180
-
 181
181 -
 182
182 -
 183
183 -
 184
184 -
 185
185 -
 186
186 -
 187
187 -
 188
188 -
 189
189 -
 190
190 -
 191
191 -
 192
192 -
 193
193 -
 194
194 -
 195
195 -
 196
196 -
 197
197 -
 198
198 -
 199
199 -
 200
200 -
 201
201 -
202
-
203
-
204
-
205
-
206
-
207
-
208
-
209
-
210
-
211
-
212
-
213
-
214
-
215
-
216
-
217
-
218
-
219
-
220
-
221
-
222
-
223
-
224
-
225
-
226
-
227
-
228
-
229
-
230
-
231
-
232
-
233
-
234
-
235
-
236
-
237
-
238
-
239
-
240
-
241
-
242
-
243
-
244
-
245
-
246
-
247
-
248
-
249
-
250
-
251
-
252
-
253
-
254
-
255
-
256
-
257
-
258
-
259
-
260
-
261
-
262
-
263
-
264
-
265
-
266
-
267
-
268
-
269
-
270
-
271
-
272
-
273
-
274
-
275
-
276
-
277
-
278
-
279
-
280
-
281
-
282
-
283
-
284
-
285
-
286
-
287
-
288
-
289
-
290
-
291
-
292
-
293
-
294
-
295
-
296
-
297
-
298
-
299
-
300
-
301
-
302
-
303
-
304
-
305
-
306
-
307
-
308
-
309
-
310
-
311
-
312
-
313
-
314
-
315
-
316
-
317
-
318
-
319
-
320
-
321
-
322
-
323
-
324
-
325
-
326
-
327
-
328
-
329
-
330
-
331
-
332
 |
 |

173
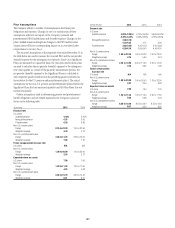
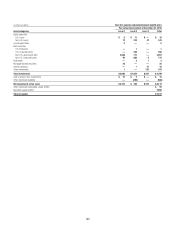
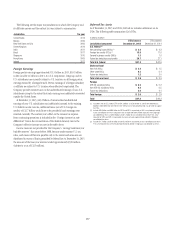
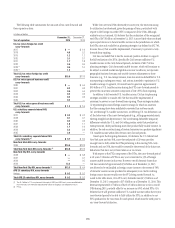
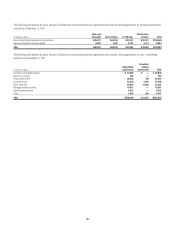
Estimated Future Benefit Payments
The Company expects to pay the following estimated benefit payments in future years:
Pension plans Postretirement benefit plans
In millions of dollars U.S. plans Non-U.S. plans U.S. plans Non-U.S. plans
2016 $ 903 $ 377 $ 71 $ 63
2017 818 337 70 67
2018 828 359 68 72
2019 848 382 67 77
2020 876 415 65 83
2021–2025 4,523 2,467 303 523
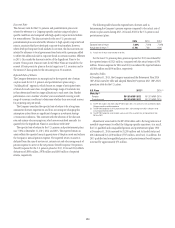
Prescription Drugs
In December 2003, the Medicare Prescription Drug Improvement and
Modernization Act of 2003 (Act of 2003) was enacted. The Act of 2003
established a prescription drug benefit under Medicare known as “Medicare
Part D,” and a federal subsidy to sponsors of U.S. retiree health care benefit
plans that provide a benefit that is at least actuarially equivalent to Medicare
Part D. The benefits provided to certain participants are at least actuarially
equivalent to Medicare Part D and, accordingly, the Company is entitled to
a subsidy.
The subsidy reduced the accumulated postretirement benefit obligation
(APBO) by approximately $5 million as of December 31, 2015 and 2014 and
the postretirement expense by approximately $0.2 million for 2015 and 2014.
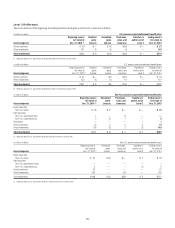
The following table shows the estimated future benefit payments for the
Medicare Part D of the U.S. postretirement plan.
In millions of dollars
Expected U.S.
postretirement benefit payments
Before Medicare
Part D subsidy
Medicare
Part D subsidy
After Medicare
Part D subsidy
2016 $ 71 $— $ 71
2017 70 — 70
2018 68 — 68
2019 67 — 67
2020 65 — 65
2021–2025 303 2 301
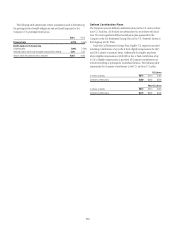
Certain provisions of the Patient Protection and Affordable Care Act of
2010 improved the Medicare Part D option known as the Employer Group
Waiver Plan (EGWP) with respect to the Medicare Part D subsidy. The
EGWP provides prescription drug benefits that are more cost effective for
Medicare-eligible participants and large employers. Effective April 1, 2013,
the Company began sponsoring and implementing an EGWP for eligible
retirees. The Company subsidy received under the EGWP for 2015 and 2014
was $11.6 million and $11.0 million, respectively.
The other provisions of the Act of 2010 are not expected to have a
significant impact on Citigroup’s pension and postretirement plans.
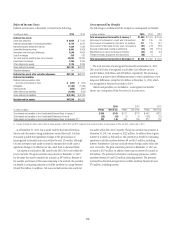
Postemployment Plans
The Company sponsors U.S. postemployment plans that provide income
continuation and health and welfare benefits to certain eligible U.S.
employees on long-term disability.
As of December 31, 2015 and 2014, the plans’ funded status recognized
in the Company’s Consolidated Balance Sheet was $(183) million and
$(256) million, respectively. The amounts recognized in Accumulated
other comprehensive income (loss) as of December 31, 2015 and 2014 were
$45 million and $24 million, respectively. Effective January 1, 2014, the
Company made changes to its postemployment plans that limit the period
for which future disabled employees are eligible for continued Company
subsidized medical benefits.
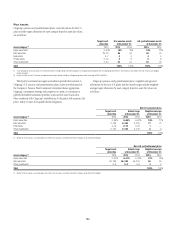
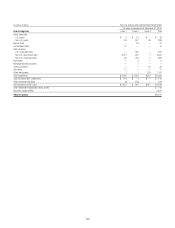
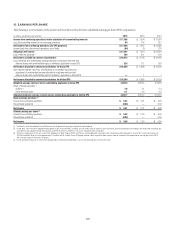
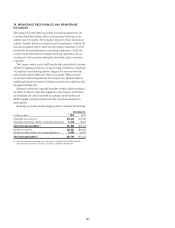
The following table summarizes the components of net expense
recognized in the Consolidated Statement of Income for the Company’s U.S.
postemployment plans.
Net expense
In millions of dollars 2015 2014 2013
Service related expense
Service cost $ — $ — $ 20
Interest cost 45 10
Prior service (benefit) (31) (31) (3)
Net actuarial loss 12 14 17
Total service related expense $(15) $(12) $ 44
Non-service related expense (benefit) $ 3 $ 37 $(14)
Total net (benefit) expense $(12) $ 25 $ 30