Citibank 2015 Annual Report Download - page 36
Download and view the complete annual report
Please find page 36 of the 2015 Citibank annual report below. You can navigate through the pages in the report by either clicking on the pages listed below, or by using the keyword search tool below to find specific information within the annual report.-
 1
1 -
2
-
3
-
4
-
5
-
6
-
7
-
8
-
9
-
10
-
11
-
12
-
13
-
14
-
15
-
16
-
17
-
18
-
19
-
20
-
21
-
22
-
23
-
24
-
25
-
 26
26 -
 27
27 -
 28
28 -
 29
29 -
 30
30 -
 31
31 -
 32
32 -
 33
33 -
 34
34 -
 35
35 -
 36
36 -
 37
37 -
 38
38 -
 39
39 -
 40
40 -
 41
41 -
 42
42 -
 43
43 -
 44
44 -
 45
45 -
 46
46 -
47
-
48
-
49
-
50
-
51
-
52
-
53
-
54
-
55
-
56
-
57
-
58
-
59
-
60
-
61
-
62
-
63
-
64
-
65
-
66
-
67
-
68
-
69
-
70
-
71
-
72
-
73
-
74
-
75
-
76
-
77
-
78
-
79
-
80
-
81
-
82
-
83
-
84
-
85
-
86
-
87
-
88
-
89
-
90
-
91
-
92
-
93
-
94
-
95
-
96
-
97
-
98
-
99
-
100
-
101
-
102
-
103
-
104
-
105
-
106
-
107
-
108
-
109
-
110
-
111
-
112
-
113
-
114
-
115
-
116
-
117
-
118
-
119
-
120
-
121
-
122
-
123
-
124
-
125
-
126
-
127
-
128
-
129
-
130
-
131
-
132
-
133
-
134
-
135
-
136
-
137
-
138
-
139
-
140
-
141
-
142
-
143
-
144
-
145
-
146
-
147
-
148
-
149
-
150
-
151
-
152
-
153
-
154
-
155
-
156
-
157
-
158
-
159
-
160
-
161
-
162
-
163
-
164
-
165
-
166
-
167
-
168
-
169
-
170
-
171
-
172
-
173
-
174
-
175
-
176
-
177
-
178
-
179
-
180
-
181
-
182
-
183
-
184
-
185
-
186
-
187
-
188
-
189
-
190
-
191
-
192
-
193
-
194
-
195
-
196
-
197
-
198
-
199
-
200
-
201
-
202
-
203
-
204
-
205
-
206
-
207
-
208
-
209
-
210
-
211
-
212
-
213
-
214
-
215
-
216
-
217
-
218
-
219
-
220
-
221
-
222
-
223
-
224
-
225
-
226
-
227
-
228
-
229
-
230
-
231
-
232
-
233
-
234
-
235
-
236
-
237
-
238
-
239
-
240
-
241
-
242
-
243
-
244
-
245
-
246
-
247
-
248
-
249
-
250
-
251
-
252
-
253
-
254
-
255
-
256
-
257
-
258
-
259
-
260
-
261
-
262
-
263
-
264
-
265
-
266
-
267
-
268
-
269
-
270
-
271
-
272
-
273
-
274
-
275
-
276
-
277
-
278
-
279
-
280
-
281
-
282
-
283
-
284
-
285
-
286
-
287
-
288
-
289
-
290
-
291
-
292
-
293
-
294
-
295
-
296
-
297
-
298
-
299
-
300
-
301
-
302
-
303
-
304
-
305
-
306
-
307
-
308
-
309
-
310
-
311
-
312
-
313
-
314
-
315
-
316
-
317
-
318
-
319
-
320
-
321
-
322
-
323
-
324
-
325
-
326
-
327
-
328
-
329
-
330
-
331
-
332
 |
 |

18
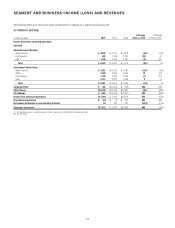
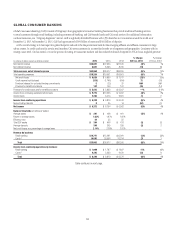
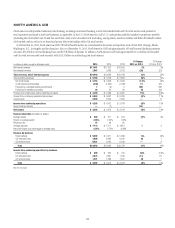
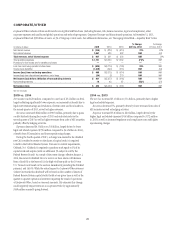
NORTH AMERICA GCB
North America GCB provides traditional retail banking, including commercial banking, and its Citi-branded cards and Citi retail services card products to
retail customers and small to mid-size businesses, as applicable, in the U.S. North America GCB’s U.S. cards product portfolio includes its proprietary portfolio
(including the Citi Double Cash, Thank You and Value cards) and co-branded cards (including, among others, American Airlines and Hilton Worldwide) within
Citi-branded cards as well as its co-brand and private label relationships within Citi retail services.
As of December 31, 2015, North America GCB’s 780 retail bank branches are concentrated in the six key metropolitan areas of New York, Chicago, Miami,
Washington, D.C., Los Angeles and San Francisco. Also as of December 31, 2015, North America GCB had approximately 10.9 million retail banking customer
accounts, $51.8 billion of retail banking loans and $172.8 billion of deposits. In addition, North America GCB had approximately 113.4 million Citi-branded
and Citi retail services credit card accounts, with $113.3 billion in outstanding card loan balances.
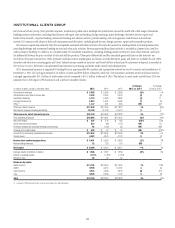
In millions of dollars, except as otherwise noted 2015 2014 2013
% Change
2015 vs. 2014
% Change
2014 vs. 2013
Net interest revenue $17,481 $17,203 $16,656 2% 3%
Non-interest revenue 1,967 2,466 3,142 (20) (22)
Total revenues, net of interest expense $19,448 $19,669 $19,798 (1)% (1)%
Total operating expenses $ 9,186 $ 9,706 $ 9,853 (5)% (1)%
Net credit losses $ 3,753 $ 4,206 $ 4,636 (11)% (9)%
Credit reserve build (release) (339) (1,242) (1,036) 73 (20)
Provision for unfunded lending commitments 7(8) 6 NM NM
Provisions for benefits and claims 38 40 59 (5) (32)
Provisions for credit losses and for benefits and claims $ 3,459 $ 2,996 $ 3,665 15% (18)%
Income from continuing operations before taxes $ 6,803 $ 6,967 $ 6,280 (2)% 11%
Income taxes 2,548 2,555 2,362 —8
Income from continuing operations $ 4,255 $ 4,412 $ 3,918 (4)% 13%
Noncontrolling interests —(1) — 100 —
Net income $ 4,255 $ 4,413 $ 3,918 (4)% 13%
Balance Sheet data (in billions of dollars)
Average assets $ 208 $ 211 $ 204 (1)% 3%
Return on average assets 2.05% 2.09% 1.92%
Efficiency ratio 47 49 50
Average deposits $ 171.8 $ 170.7 $ 166.0 13
Net credit losses as a percentage of average loans 2.39% 2.70% 3.09%
Revenue by business
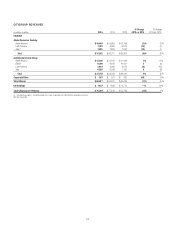
Retail banking $ 5,208 $ 4,917 $ 5,389 6% (9)%
Citi-branded cards 7,809 8,290 8,220 (6) 1
Citi retail services 6,431 6,462 6,189 —4
Total $19,448 $19,669 $19,798 (1)% (1)%
Income from continuing operations by business
Retail banking $ 659 $ 355 $ 416 86% (15)%
Citi-branded cards 2,075 2,391 1,945 (13) 23
Citi retail services 1,521 1,666 1,557 (9) 7
Total $ 4,255 $ 4,412 $ 3,918 (4)% 13%
NM Not meaningful