Citibank 2015 Annual Report Download - page 282
Download and view the complete annual report
Please find page 282 of the 2015 Citibank annual report below. You can navigate through the pages in the report by either clicking on the pages listed below, or by using the keyword search tool below to find specific information within the annual report.-
 1
1 -
2
-
3
-
4
-
5
-
6
-
7
-
8
-
9
-
10
-
11
-
12
-
13
-
14
-
15
-
16
-
17
-
18
-
19
-
20
-
21
-
22
-
23
-
24
-
25
-
26
-
27
-
28
-
29
-
30
-
31
-
32
-
33
-
34
-
35
-
36
-
37
-
38
-
39
-
40
-
41
-
42
-
43
-
44
-
45
-
46
-
47
-
48
-
49
-
50
-
51
-
52
-
53
-
54
-
55
-
56
-
57
-
58
-
59
-
60
-
61
-
62
-
63
-
64
-
65
-
66
-
67
-
68
-
69
-
70
-
71
-
72
-
73
-
74
-
75
-
76
-
77
-
78
-
79
-
80
-
81
-
82
-
83
-
84
-
85
-
86
-
87
-
88
-
89
-
90
-
91
-
92
-
93
-
94
-
95
-
96
-
97
-
98
-
99
-
100
-
101
-
102
-
103
-
104
-
105
-
106
-
107
-
108
-
109
-
110
-
111
-
112
-
113
-
114
-
115
-
116
-
117
-
118
-
119
-
120
-
121
-
122
-
123
-
124
-
125
-
126
-
127
-
128
-
129
-
130
-
131
-
132
-
133
-
134
-
135
-
136
-
137
-
138
-
139
-
140
-
141
-
142
-
143
-
144
-
145
-
146
-
147
-
148
-
149
-
150
-
151
-
152
-
153
-
154
-
155
-
156
-
157
-
158
-
159
-
160
-
161
-
162
-
163
-
164
-
165
-
166
-
167
-
168
-
169
-
170
-
171
-
172
-
173
-
174
-
175
-
176
-
177
-
178
-
179
-
180
-
181
-
182
-
183
-
184
-
185
-
186
-
187
-
188
-
189
-
190
-
191
-
192
-
193
-
194
-
195
-
196
-
197
-
198
-
199
-
200
-
201
-
202
-
203
-
204
-
205
-
206
-
207
-
208
-
209
-
210
-
211
-
212
-
213
-
214
-
215
-
216
-
217
-
218
-
219
-
220
-
221
-
222
-
223
-
224
-
225
-
226
-
227
-
228
-
229
-
230
-
231
-
232
-
233
-
234
-
235
-
236
-
237
-
238
-
239
-
240
-
241
-
242
-
243
-
244
-
245
-
246
-
247
-
248
-
249
-
250
-
251
-
252
-
253
-
254
-
255
-
256
-
257
-
258
-
259
-
260
-
261
-
262
-
263
-
264
-
265
-
266
-
267
-
268
-
269
-
270
-
271
-
 272
272 -
 273
273 -
 274
274 -
 275
275 -
 276
276 -
 277
277 -
 278
278 -
 279
279 -
 280
280 -
 281
281 -
 282
282 -
 283
283 -
 284
284 -
 285
285 -
 286
286 -
 287
287 -
 288
288 -
 289
289 -
 290
290 -
 291
291 -
 292
292 -
293
-
294
-
295
-
296
-
297
-
298
-
299
-
300
-
301
-
302
-
303
-
304
-
305
-
306
-
307
-
308
-
309
-
310
-
311
-
312
-
313
-
314
-
315
-
316
-
317
-
318
-
319
-
320
-
321
-
322
-
323
-
324
-
325
-
326
-
327
-
328
-
329
-
330
-
331
-
332
 |
 |

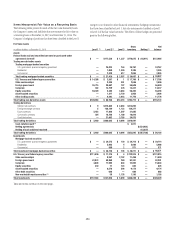
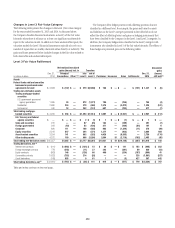
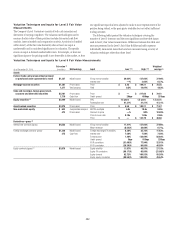
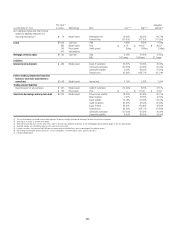
264
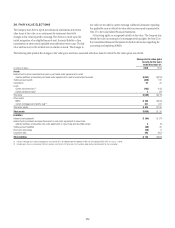
As of December 31, 2014
Fair value (1)
Methodology Input Low (2)(3) High (2)(3)
Weighted
average (4)
(in millions)
Assets
Federal funds sold and securities
borrowed or purchased under
agreements to resell $3,156 Model-based Interest rate 1.27% 1.97% 1.80%
Mortgage-backed securities $2,874 Price-based Price $ — $ 127.87 $ 81.43
1,117 Yield analysis Yield 0.01% 19.91% 5.89%
State and municipal, foreign government,
corporate and other debt securities $5,937 Price-based Price $ — $ 124.00 $ 90.62
1,860 Cash flow Credit spread 25bps 600bps 233bps
Equity securities (5) $2,163 Price-based Price (5) $ — $ 141.00 $ 91.00
679 Cash flow Yield 4.00% 5.00% 4.50%
WAL 0.01 years 3.14 years 1.07 years
Asset-backed securities $3,607 Price-based Price $ — $ 105.50 $ 67.01
Non-marketable equity $1,224 Price-based Discount to price —% 90.00% 4.04%
1,055 Comparables analysis EBITDA multiples 2.90x 13.10x 9.77x
PE ratio 8.10x 13.10x 8.43x
Price-to-book ratio 0.99x 1.56x 1.15x
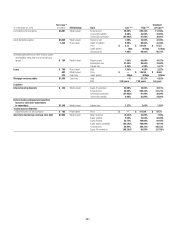
Derivatives—gross (6)
Interest rate contracts (gross) $8,309 Model-based Interest rate (IR)
log-normal volatility 18.05% 90.65% 30.21%
Mean reversion 1.00% 20.00% 10.50%
Foreign exchange contracts (gross) $1,428 Model-based Foreign exchange (FX) volatility 0.37% 58.40% 8.57%
294 Cash flow Interest rate 3.72% 8.27% 5.02%
IR-FX correlation 40.00% 60.00% 50.00%
Equity contracts (gross) (7) $4,431 Model-based Equity volatility 9.56% 82.44% 24.61%
502 Price-based Equity forward 84.10% 100.80% 94.10%
Equity-FX correlation (88.20)% 48.70% (25.17)%
Equity-equity correlation (66.30)% 94.80% 36.87%
Price $ 0.01 $ 144.50 $ 93.05
Commodity contracts (gross) $3,606 Model-based Commodity volatility 5.00% 83.00% 24.00%
Commodity correlation (57.00)% 91.00% 30.00%
Forward price 35.34% 268.77% 101.74%
Credit derivatives (gross) $4,944 Model-based Recovery rate 13.97% 75.00% 37.62%
1,584 Price-based Credit correlation —% 95.00% 58.76%
Price $ 1.00 $ 144.50 $ 53.86
Credit spread 1bps 3,380bps 180bps
Upfront points 0.39 100.00 52.26