Citibank 2015 Annual Report Download - page 267
Download and view the complete annual report
Please find page 267 of the 2015 Citibank annual report below. You can navigate through the pages in the report by either clicking on the pages listed below, or by using the keyword search tool below to find specific information within the annual report.-
 1
1 -
2
-
3
-
4
-
5
-
6
-
7
-
8
-
9
-
10
-
11
-
12
-
13
-
14
-
15
-
16
-
17
-
18
-
19
-
20
-
21
-
22
-
23
-
24
-
25
-
26
-
27
-
28
-
29
-
30
-
31
-
32
-
33
-
34
-
35
-
36
-
37
-
38
-
39
-
40
-
41
-
42
-
43
-
44
-
45
-
46
-
47
-
48
-
49
-
50
-
51
-
52
-
53
-
54
-
55
-
56
-
57
-
58
-
59
-
60
-
61
-
62
-
63
-
64
-
65
-
66
-
67
-
68
-
69
-
70
-
71
-
72
-
73
-
74
-
75
-
76
-
77
-
78
-
79
-
80
-
81
-
82
-
83
-
84
-
85
-
86
-
87
-
88
-
89
-
90
-
91
-
92
-
93
-
94
-
95
-
96
-
97
-
98
-
99
-
100
-
101
-
102
-
103
-
104
-
105
-
106
-
107
-
108
-
109
-
110
-
111
-
112
-
113
-
114
-
115
-
116
-
117
-
118
-
119
-
120
-
121
-
122
-
123
-
124
-
125
-
126
-
127
-
128
-
129
-
130
-
131
-
132
-
133
-
134
-
135
-
136
-
137
-
138
-
139
-
140
-
141
-
142
-
143
-
144
-
145
-
146
-
147
-
148
-
149
-
150
-
151
-
152
-
153
-
154
-
155
-
156
-
157
-
158
-
159
-
160
-
161
-
162
-
163
-
164
-
165
-
166
-
167
-
168
-
169
-
170
-
171
-
172
-
173
-
174
-
175
-
176
-
177
-
178
-
179
-
180
-
181
-
182
-
183
-
184
-
185
-
186
-
187
-
188
-
189
-
190
-
191
-
192
-
193
-
194
-
195
-
196
-
197
-
198
-
199
-
200
-
201
-
202
-
203
-
204
-
205
-
206
-
207
-
208
-
209
-
210
-
211
-
212
-
213
-
214
-
215
-
216
-
217
-
218
-
219
-
220
-
221
-
222
-
223
-
224
-
225
-
226
-
227
-
228
-
229
-
230
-
231
-
232
-
233
-
234
-
235
-
236
-
237
-
238
-
239
-
240
-
241
-
242
-
243
-
244
-
245
-
246
-
247
-
248
-
249
-
250
-
251
-
252
-
253
-
254
-
255
-
256
-
 257
257 -
 258
258 -
 259
259 -
 260
260 -
 261
261 -
 262
262 -
 263
263 -
 264
264 -
 265
265 -
 266
266 -
 267
267 -
 268
268 -
 269
269 -
 270
270 -
 271
271 -
 272
272 -
 273
273 -
 274
274 -
 275
275 -
 276
276 -
 277
277 -
278
-
279
-
280
-
281
-
282
-
283
-
284
-
285
-
286
-
287
-
288
-
289
-
290
-
291
-
292
-
293
-
294
-
295
-
296
-
297
-
298
-
299
-
300
-
301
-
302
-
303
-
304
-
305
-
306
-
307
-
308
-
309
-
310
-
311
-
312
-
313
-
314
-
315
-
316
-
317
-
318
-
319
-
320
-
321
-
322
-
323
-
324
-
325
-
326
-
327
-
328
-
329
-
330
-
331
-
332
 |
 |
249
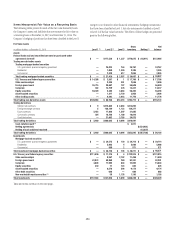
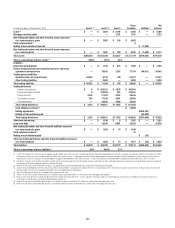
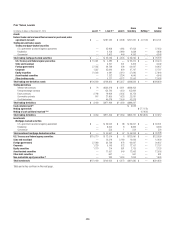
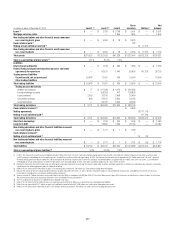
25. FAIR VALUE MEASUREMENT
ASC 820-10 Fair Value Measurement, defines fair value, establishes a
consistent framework for measuring fair value and requires disclosures about
fair value measurements. Fair value is defined as the price that would be
received to sell an asset or paid to transfer a liability in an orderly transaction
between market participants at the measurement date. Among other things,
the standard requires the Company to maximize the use of observable inputs
and minimize the use of unobservable inputs when measuring fair value.
Under ASC 820-10, the probability of default of a counterparty is factored
into the valuation of derivative and other positions as well as the impact of
Citigroup’s own credit risk on derivatives and other liabilities measured at
fair value.
Fair Value Hierarchy
ASC 820-10 specifies a hierarchy of inputs based on whether the inputs are
observable or unobservable. Observable inputs are developed using market
data and reflect market participant assumptions, while unobservable inputs
reflect the Company’s market assumptions. These two types of inputs have
created the following fair value hierarchy:
• Level 1: Quoted prices for identical instruments in active markets.
• Level 2: Quoted prices for similar instruments in active markets; quoted
prices for identical or similar instruments in markets that are not
active; and model-derived valuations in which all significant inputs and
significant value drivers are observable in active markets.
• Level 3: Valuations derived from valuation techniques in which one or
more significant inputs or significant value drivers are unobservable.
As required under the fair value hierarchy, the Company considers
relevant and observable market inputs in its valuations where possible. The
frequency of transactions, the size of the bid-ask spread and the amount of
adjustment necessary when comparing similar transactions are all factors in
determining the liquidity of markets and the relevance of observed prices in
those markets.
The Company’s policy with respect to transfers between levels of the fair
value hierarchy is to recognize transfers into and out of each level as of the
end of the reporting period.
Determination of Fair Value
For assets and liabilities carried at fair value, the Company measures fair
value using the procedures set out below, irrespective of whether the assets
and liabilities are measured at fair value as a result of an election or whether
they are required to be measured at fair value.
When available, the Company uses quoted market prices to determine fair
value and classifies such items as Level 1. In some cases where a market price
is available, the Company will make use of acceptable practical expedients
(such as matrix pricing) to calculate fair value, in which case the items are
classified as Level 2.
The Company may also apply a price-based methodology, which utilizes,
where available, quoted prices or other market information obtained from
recent trading activity in positions with the same or similar characteristics
to the position being valued. The market activity and the amount of the
bid-ask spread are among the factors considered in determining the liquidity
of markets and the observability of prices from those markets. If relevant and
observable prices are available, those valuations may be classified as Level 2.
When less liquidity exists for a security or loan, a quoted price is stale, a
significant adjustment to the price of a similar security is necessary to reflect
differences in the terms of the actual security or loan being valued, or prices
from independent sources are insufficient to corroborate the valuation, the
“price” inputs are considered unobservable and the fair value measurements
are classified as Level 3.
If quoted market prices are not available, fair value is based upon
internally developed valuation techniques that use, where possible, current
market-based parameters, such as interest rates, currency rates and
option volatilities. Items valued using such internally generated valuation
techniques are classified according to the lowest level input or value driver
that is significant to the valuation. Thus, an item may be classified as Level 3
even though there may be some significant inputs that are readily observable.
Fair value estimates from internal valuation techniques are verified,
where possible, to prices obtained from independent vendors or brokers.
Vendors’ and brokers’ valuations may be based on a variety of inputs ranging
from observed prices to proprietary valuation models.
The following section describes the valuation methodologies used by
the Company to measure various financial instruments at fair value,
including an indication of the level in the fair value hierarchy in which each
instrument is generally classified. Where appropriate, the description includes
details of the valuation models, the key inputs to those models and any
significant assumptions.
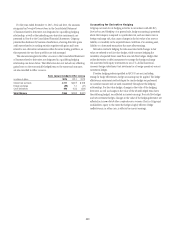
Market Valuation Adjustments
Generally, the unit of account for a financial instrument is the individual
financial instrument. The Company applies market valuation adjustments
that are consistent with the unit of account, which does not include
adjustment due to the size of the Company’s position, except as follows.
ASC 820-10 permits an exception, through an accounting policy election,
to measure the fair value of a portfolio of financial assets and financial
liabilities on the basis of the net open risk position when certain criteria are
met. Citi has elected to measure certain portfolios of financial instruments,
such as derivatives, that meet those criteria on the basis of the net open risk
position. The Company applies market valuation adjustments, including
adjustments to account for the size of the net open risk position, consistent
with market participant assumptions and in accordance with the unit
of account.