Citibank 2015 Annual Report Download - page 281
Download and view the complete annual report
Please find page 281 of the 2015 Citibank annual report below. You can navigate through the pages in the report by either clicking on the pages listed below, or by using the keyword search tool below to find specific information within the annual report.-
 1
1 -
2
-
3
-
4
-
5
-
6
-
7
-
8
-
9
-
10
-
11
-
12
-
13
-
14
-
15
-
16
-
17
-
18
-
19
-
20
-
21
-
22
-
23
-
24
-
25
-
26
-
27
-
28
-
29
-
30
-
31
-
32
-
33
-
34
-
35
-
36
-
37
-
38
-
39
-
40
-
41
-
42
-
43
-
44
-
45
-
46
-
47
-
48
-
49
-
50
-
51
-
52
-
53
-
54
-
55
-
56
-
57
-
58
-
59
-
60
-
61
-
62
-
63
-
64
-
65
-
66
-
67
-
68
-
69
-
70
-
71
-
72
-
73
-
74
-
75
-
76
-
77
-
78
-
79
-
80
-
81
-
82
-
83
-
84
-
85
-
86
-
87
-
88
-
89
-
90
-
91
-
92
-
93
-
94
-
95
-
96
-
97
-
98
-
99
-
100
-
101
-
102
-
103
-
104
-
105
-
106
-
107
-
108
-
109
-
110
-
111
-
112
-
113
-
114
-
115
-
116
-
117
-
118
-
119
-
120
-
121
-
122
-
123
-
124
-
125
-
126
-
127
-
128
-
129
-
130
-
131
-
132
-
133
-
134
-
135
-
136
-
137
-
138
-
139
-
140
-
141
-
142
-
143
-
144
-
145
-
146
-
147
-
148
-
149
-
150
-
151
-
152
-
153
-
154
-
155
-
156
-
157
-
158
-
159
-
160
-
161
-
162
-
163
-
164
-
165
-
166
-
167
-
168
-
169
-
170
-
171
-
172
-
173
-
174
-
175
-
176
-
177
-
178
-
179
-
180
-
181
-
182
-
183
-
184
-
185
-
186
-
187
-
188
-
189
-
190
-
191
-
192
-
193
-
194
-
195
-
196
-
197
-
198
-
199
-
200
-
201
-
202
-
203
-
204
-
205
-
206
-
207
-
208
-
209
-
210
-
211
-
212
-
213
-
214
-
215
-
216
-
217
-
218
-
219
-
220
-
221
-
222
-
223
-
224
-
225
-
226
-
227
-
228
-
229
-
230
-
231
-
232
-
233
-
234
-
235
-
236
-
237
-
238
-
239
-
240
-
241
-
242
-
243
-
244
-
245
-
246
-
247
-
248
-
249
-
250
-
251
-
252
-
253
-
254
-
255
-
256
-
257
-
258
-
259
-
260
-
261
-
262
-
263
-
264
-
265
-
266
-
267
-
268
-
269
-
270
-
 271
271 -
 272
272 -
 273
273 -
 274
274 -
 275
275 -
 276
276 -
 277
277 -
 278
278 -
 279
279 -
 280
280 -
 281
281 -
 282
282 -
 283
283 -
 284
284 -
 285
285 -
 286
286 -
 287
287 -
 288
288 -
 289
289 -
 290
290 -
 291
291 -
292
-
293
-
294
-
295
-
296
-
297
-
298
-
299
-
300
-
301
-
302
-
303
-
304
-
305
-
306
-
307
-
308
-
309
-
310
-
311
-
312
-
313
-
314
-
315
-
316
-
317
-
318
-
319
-
320
-
321
-
322
-
323
-
324
-
325
-
326
-
327
-
328
-
329
-
330
-
331
-
332
 |
 |

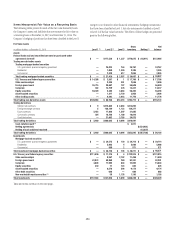
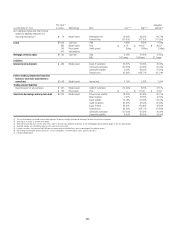
263
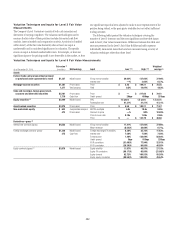
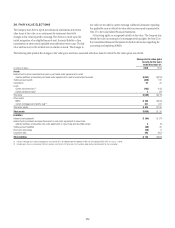
As of December 31, 2015
Fair value (1)
Methodology Input Low (2)(3) High (2)(3)
Weighted
average (4)
(in millions)
Commodity contracts (gross) $4,061 Model-based Forward price 35.09% 299.32% 112.98%
Commodity volatility 5.00% 83.00% 24.00%
Commodity correlation (57.00)% 91.00% 30.00%
Credit derivatives (gross) $5,849 Model-based Recovery rate 1.00% 75.00% 32.49%
1,424 Price-based Credit correlation 5.00% 90.00% 43.48%
Price $ 0.33 $ 101.00 $ 61.52
Credit spread 1bps 967bps 133 bps
Upfront points 7.00% 99.92% 66.75%
Nontrading derivatives and other financial assets
and liabilities measured on a recurring basis
(gross) (6) $ 194 Model-based Recovery rate 7.00% 40.00% 10.72%
Redemption rate 27.00% 99.50% 74.80%
Interest rate 5.26% 5.28% 5.27%
Loans $ 750 Price-based Yield 1.50% 4.50% 2.52%
892 Model-based Price $ — $ 106.98 $ 40.69
524 Cash flow Credit spread 29bps 500bps 105bps
Mortgage servicing rights $1,690 Cash flow Yield —% 23.32% 6.83%
WAL 3.38 years 7.48 years 5.5 years
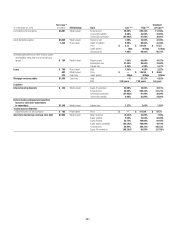
Liabilities
Interest-bearing deposits $ 434 Model-based Equity-IR correlation 23.00% 39.00% 34.51%
Forward price 35.09% 299.32% 112.72%
Commodity correlation (57.00)% 91.00% 30.00%
Commodity volatility 5.00% 83.00% 24.00%
Federal funds purchased and securities
loaned or sold under agreements
to repurchase $1,245 Model-based Interest rate 1.27% 2.02% 1.92%
Trading account liabilities
Securities sold, not yet purchased $ 152 Price-based Price $ — $ 217.00 $ 87.78
Short-term borrowings and long-term debt $7,004 Model-based Mean reversion (5.52)% 20.00% 7.80%
Equity volatility 9.55% 42.56% 22.26%
Equity forward 82.72% 100.80% 94.48%
Equity-equity correlation (80.54)% 100.00% 49.16%
Forward price 35.09% 299.32% 106.32%
Equity-FX correlation (88.20)% 56.85% (31.76)%