Citibank 2015 Annual Report Download - page 181
Download and view the complete annual report
Please find page 181 of the 2015 Citibank annual report below. You can navigate through the pages in the report by either clicking on the pages listed below, or by using the keyword search tool below to find specific information within the annual report.-
 1
1 -
2
-
3
-
4
-
5
-
6
-
7
-
8
-
9
-
10
-
11
-
12
-
13
-
14
-
15
-
16
-
17
-
18
-
19
-
20
-
21
-
22
-
23
-
24
-
25
-
26
-
27
-
28
-
29
-
30
-
31
-
32
-
33
-
34
-
35
-
36
-
37
-
38
-
39
-
40
-
41
-
42
-
43
-
44
-
45
-
46
-
47
-
48
-
49
-
50
-
51
-
52
-
53
-
54
-
55
-
56
-
57
-
58
-
59
-
60
-
61
-
62
-
63
-
64
-
65
-
66
-
67
-
68
-
69
-
70
-
71
-
72
-
73
-
74
-
75
-
76
-
77
-
78
-
79
-
80
-
81
-
82
-
83
-
84
-
85
-
86
-
87
-
88
-
89
-
90
-
91
-
92
-
93
-
94
-
95
-
96
-
97
-
98
-
99
-
100
-
101
-
102
-
103
-
104
-
105
-
106
-
107
-
108
-
109
-
110
-
111
-
112
-
113
-
114
-
115
-
116
-
117
-
118
-
119
-
120
-
121
-
122
-
123
-
124
-
125
-
126
-
127
-
128
-
129
-
130
-
131
-
132
-
133
-
134
-
135
-
136
-
137
-
138
-
139
-
140
-
141
-
142
-
143
-
144
-
145
-
146
-
147
-
148
-
149
-
150
-
151
-
152
-
153
-
154
-
155
-
156
-
157
-
158
-
159
-
160
-
161
-
162
-
163
-
164
-
165
-
166
-
167
-
168
-
169
-
170
-
 171
171 -
 172
172 -
 173
173 -
 174
174 -
 175
175 -
 176
176 -
 177
177 -
 178
178 -
 179
179 -
 180
180 -
 181
181 -
 182
182 -
 183
183 -
 184
184 -
 185
185 -
 186
186 -
 187
187 -
 188
188 -
 189
189 -
 190
190 -
 191
191 -
192
-
193
-
194
-
195
-
196
-
197
-
198
-
199
-
200
-
201
-
202
-
203
-
204
-
205
-
206
-
207
-
208
-
209
-
210
-
211
-
212
-
213
-
214
-
215
-
216
-
217
-
218
-
219
-
220
-
221
-
222
-
223
-
224
-
225
-
226
-
227
-
228
-
229
-
230
-
231
-
232
-
233
-
234
-
235
-
236
-
237
-
238
-
239
-
240
-
241
-
242
-
243
-
244
-
245
-
246
-
247
-
248
-
249
-
250
-
251
-
252
-
253
-
254
-
255
-
256
-
257
-
258
-
259
-
260
-
261
-
262
-
263
-
264
-
265
-
266
-
267
-
268
-
269
-
270
-
271
-
272
-
273
-
274
-
275
-
276
-
277
-
278
-
279
-
280
-
281
-
282
-
283
-
284
-
285
-
286
-
287
-
288
-
289
-
290
-
291
-
292
-
293
-
294
-
295
-
296
-
297
-
298
-
299
-
300
-
301
-
302
-
303
-
304
-
305
-
306
-
307
-
308
-
309
-
310
-
311
-
312
-
313
-
314
-
315
-
316
-
317
-
318
-
319
-
320
-
321
-
322
-
323
-
324
-
325
-
326
-
327
-
328
-
329
-
330
-
331
-
332
 |
 |

163
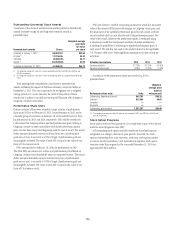
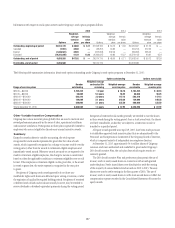
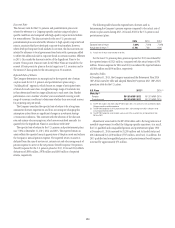
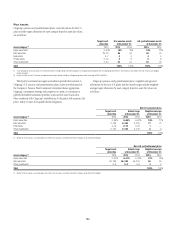
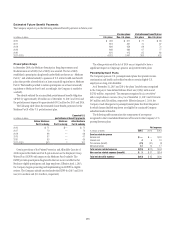
Plan Assumptions
The Company utilizes a number of assumptions to determine plan
obligations and expenses. Changes in one or a combination of these
assumptions will have an impact on the Company’s pension and
postretirement PBO, funded status and (benefit) expense. Changes in the
plans’ funded status resulting from changes in the PBO and fair value
of plan assets will have a corresponding impact on Accumulated other
comprehensive income (loss).
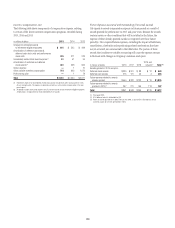
The actuarial assumptions at the respective years ended December 31 in
the table below are used to measure the year-end PBO and the net periodic
(benefit) expense for the subsequent year (period). Since Citi’s Significant
Plans are measured on a quarterly basis, the year-end rates for those plans
are used to calculate the net periodic (benefit) expense for the subsequent
year’s first quarter. As a result of the quarterly measurement process, the
net periodic (benefit) expense for the Significant Plans is calculated at
each respective quarter end based on the preceding quarter-end rates (as
shown below for the U.S. pension and postretirement plans). The actual
assumptions for the non-U.S. pension and postretirement plans relate to the
Significant Plans that are measured quarterly and All Other Plans that are
measured annually.
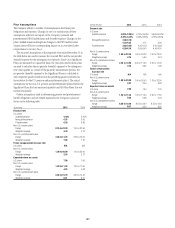
Certain assumptions used in determining pension and postretirement
benefit obligations and net benefit expense for the Company’s plans are
shown in the following table:
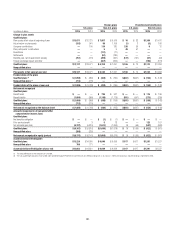
At year end 2015 2014
Discount rate
U.S. plans
Qualified pension 4.40% 4.00%
Nonqualified pension 4.35 3.90
Postretirement 4.20 3.80
Non-U.S. pension plans
Range 0.25 to 42.00 1.00 to 32.50
Weighted average 4.76 4.74
Non-U.S. postretirement plans
Range 2.00 to 13.20 2.25 to 12.00
Weighted average 7.90 7.50
Future compensation increase rate
U.S. plans N/A N/A
Non-U.S. pension plans
Range 1.00 to 40.00 1.00 to 30.00
Weighted average 3.24 3.27
Expected return on assets
U.S. plans 7.00 7.00
Non-U.S. pension plans
Range 1.60 to 11.50 1.30 to 11.50
Weighted average 4.95 5.08
Non-U.S. postretirement plans
Range 8.00 to 10.70 8.50 to 10.40
Weighted average 8.01 8.51
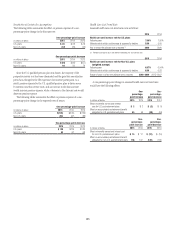
During the year 2015 2014 2013
Discount rate
U.S. plans
Qualified pension 4.00%/3.85
4.45%/4.35
%/
%
4.75%/4.55
4.25%/4.25
%/
%
3.90%/4.20
4.75%/4.80
%/
%
Nonqualified pension 3.90/3.70
4.30/4.25
/
4.75 3.90
Postretirement 3.80/3.65
4.20/4.10
/4.35/4.15
3.95/4.00
/ 3.60/3.60
4.40/4.30
/
Non-U.S. pension plans
Range 1.00 to 32.50 1.60 to 29.25 1.50 to 28.00
Weighted average 4.74 5.60 5.24
Non-U.S. postretirement plans
Range 2.25 to 12.00 3.50 to 11.90 3.50 to 10.00
Weighted average 7.50 8.65 7.46
Future compensation
increase rate
U.S. plans N/A N/A N/A
Non-U.S. pension plans
Range 1.00 to 30.00 1.00 to 26.00 1.20 to 26.00
Weighted average 3.27 3.40 3.93
Expected return on assets
U.S. plans 7.00 7.00 7.00
Non-U.S. pension plans
Range 1.30 to 11.50 1.20 to 11.50 0.90 to 11.50
Weighted average 5.08 5.68 5.76
Non-U.S. postretirement plans
Range 8.50 to 10.40 8.50 to 8.90 8.50 to 9.60
Weighted average 8.51 8.50 8.50