Citibank 2015 Annual Report Download - page 170
Download and view the complete annual report
Please find page 170 of the 2015 Citibank annual report below. You can navigate through the pages in the report by either clicking on the pages listed below, or by using the keyword search tool below to find specific information within the annual report.-
 1
1 -
2
-
3
-
4
-
5
-
6
-
7
-
8
-
9
-
10
-
11
-
12
-
13
-
14
-
15
-
16
-
17
-
18
-
19
-
20
-
21
-
22
-
23
-
24
-
25
-
26
-
27
-
28
-
29
-
30
-
31
-
32
-
33
-
34
-
35
-
36
-
37
-
38
-
39
-
40
-
41
-
42
-
43
-
44
-
45
-
46
-
47
-
48
-
49
-
50
-
51
-
52
-
53
-
54
-
55
-
56
-
57
-
58
-
59
-
60
-
61
-
62
-
63
-
64
-
65
-
66
-
67
-
68
-
69
-
70
-
71
-
72
-
73
-
74
-
75
-
76
-
77
-
78
-
79
-
80
-
81
-
82
-
83
-
84
-
85
-
86
-
87
-
88
-
89
-
90
-
91
-
92
-
93
-
94
-
95
-
96
-
97
-
98
-
99
-
100
-
101
-
102
-
103
-
104
-
105
-
106
-
107
-
108
-
109
-
110
-
111
-
112
-
113
-
114
-
115
-
116
-
117
-
118
-
119
-
120
-
121
-
122
-
123
-
124
-
125
-
126
-
127
-
128
-
129
-
130
-
131
-
132
-
133
-
134
-
135
-
136
-
137
-
138
-
139
-
140
-
141
-
142
-
143
-
144
-
145
-
146
-
147
-
148
-
149
-
150
-
151
-
152
-
153
-
154
-
155
-
156
-
157
-
158
-
159
-
 160
160 -
 161
161 -
 162
162 -
 163
163 -
 164
164 -
 165
165 -
 166
166 -
 167
167 -
 168
168 -
 169
169 -
 170
170 -
 171
171 -
 172
172 -
 173
173 -
 174
174 -
 175
175 -
 176
176 -
 177
177 -
 178
178 -
 179
179 -
 180
180 -
181
-
182
-
183
-
184
-
185
-
186
-
187
-
188
-
189
-
190
-
191
-
192
-
193
-
194
-
195
-
196
-
197
-
198
-
199
-
200
-
201
-
202
-
203
-
204
-
205
-
206
-
207
-
208
-
209
-
210
-
211
-
212
-
213
-
214
-
215
-
216
-
217
-
218
-
219
-
220
-
221
-
222
-
223
-
224
-
225
-
226
-
227
-
228
-
229
-
230
-
231
-
232
-
233
-
234
-
235
-
236
-
237
-
238
-
239
-
240
-
241
-
242
-
243
-
244
-
245
-
246
-
247
-
248
-
249
-
250
-
251
-
252
-
253
-
254
-
255
-
256
-
257
-
258
-
259
-
260
-
261
-
262
-
263
-
264
-
265
-
266
-
267
-
268
-
269
-
270
-
271
-
272
-
273
-
274
-
275
-
276
-
277
-
278
-
279
-
280
-
281
-
282
-
283
-
284
-
285
-
286
-
287
-
288
-
289
-
290
-
291
-
292
-
293
-
294
-
295
-
296
-
297
-
298
-
299
-
300
-
301
-
302
-
303
-
304
-
305
-
306
-
307
-
308
-
309
-
310
-
311
-
312
-
313
-
314
-
315
-
316
-
317
-
318
-
319
-
320
-
321
-
322
-
323
-
324
-
325
-
326
-
327
-
328
-
329
-
330
-
331
-
332
 |
 |

152
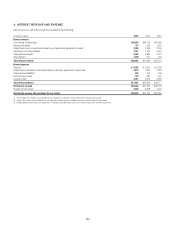
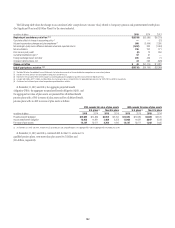
4. INTEREST REVENUE AND EXPENSE
Interest revenue and Interest expense consisted of the following:
In millions of dollars 2015 2014 2013
Interest revenue
Loan interest, including fees $40,510 $44,776 $45,580
Deposits with banks 727 959 1,026
Federal funds sold and securities borrowed or purchased under agreements to resell 2,516 2,366 2,566
Investments, including dividends 7,017 7,195 6,919
Trading account assets (1) 5,942 5,880 6,277
Other interest (2) 1,839 507 602
Total interest revenue $58,551 $61,683 $62,970
Interest expense
Deposits (3) $ 5,052 $ 5,692 $ 6,236
Federal funds purchased and securities loaned or sold under agreements to repurchase 1,614 1,895 2,339
Trading account liabilities (1) 216 168 169
Short-term borrowings 522 580 597
Long-term debt 4,517 5,355 6,836
Total interest expense $11,921 $13,690 $16,177
Net interest revenue $46,630 $47,993 $46,793
Provision for loan losses 7,108 6,828 7,604
Net interest revenue after provision for loan losses $39,522 $41,165 $39,189
(1) Interest expense on Trading account liabilities of ICG is reported as a reduction of interest revenue from Trading account assets.
(2) During 2015, interest earned related to assets of significant disposals (primarily OneMain Financial) were reclassified into Other interest.
(3) Includes deposit insurance fees and charges of $1,118 million and $1,038 million and $1,132 million for 2015, 2014 and 2013, respectively.