Citibank 2015 Annual Report Download - page 37
Download and view the complete annual report
Please find page 37 of the 2015 Citibank annual report below. You can navigate through the pages in the report by either clicking on the pages listed below, or by using the keyword search tool below to find specific information within the annual report.-
 1
1 -
2
-
3
-
4
-
5
-
6
-
7
-
8
-
9
-
10
-
11
-
12
-
13
-
14
-
15
-
16
-
17
-
18
-
19
-
20
-
21
-
22
-
23
-
24
-
25
-
26
-
 27
27 -
 28
28 -
 29
29 -
 30
30 -
 31
31 -
 32
32 -
 33
33 -
 34
34 -
 35
35 -
 36
36 -
 37
37 -
 38
38 -
 39
39 -
 40
40 -
 41
41 -
 42
42 -
 43
43 -
 44
44 -
 45
45 -
 46
46 -
 47
47 -
48
-
49
-
50
-
51
-
52
-
53
-
54
-
55
-
56
-
57
-
58
-
59
-
60
-
61
-
62
-
63
-
64
-
65
-
66
-
67
-
68
-
69
-
70
-
71
-
72
-
73
-
74
-
75
-
76
-
77
-
78
-
79
-
80
-
81
-
82
-
83
-
84
-
85
-
86
-
87
-
88
-
89
-
90
-
91
-
92
-
93
-
94
-
95
-
96
-
97
-
98
-
99
-
100
-
101
-
102
-
103
-
104
-
105
-
106
-
107
-
108
-
109
-
110
-
111
-
112
-
113
-
114
-
115
-
116
-
117
-
118
-
119
-
120
-
121
-
122
-
123
-
124
-
125
-
126
-
127
-
128
-
129
-
130
-
131
-
132
-
133
-
134
-
135
-
136
-
137
-
138
-
139
-
140
-
141
-
142
-
143
-
144
-
145
-
146
-
147
-
148
-
149
-
150
-
151
-
152
-
153
-
154
-
155
-
156
-
157
-
158
-
159
-
160
-
161
-
162
-
163
-
164
-
165
-
166
-
167
-
168
-
169
-
170
-
171
-
172
-
173
-
174
-
175
-
176
-
177
-
178
-
179
-
180
-
181
-
182
-
183
-
184
-
185
-
186
-
187
-
188
-
189
-
190
-
191
-
192
-
193
-
194
-
195
-
196
-
197
-
198
-
199
-
200
-
201
-
202
-
203
-
204
-
205
-
206
-
207
-
208
-
209
-
210
-
211
-
212
-
213
-
214
-
215
-
216
-
217
-
218
-
219
-
220
-
221
-
222
-
223
-
224
-
225
-
226
-
227
-
228
-
229
-
230
-
231
-
232
-
233
-
234
-
235
-
236
-
237
-
238
-
239
-
240
-
241
-
242
-
243
-
244
-
245
-
246
-
247
-
248
-
249
-
250
-
251
-
252
-
253
-
254
-
255
-
256
-
257
-
258
-
259
-
260
-
261
-
262
-
263
-
264
-
265
-
266
-
267
-
268
-
269
-
270
-
271
-
272
-
273
-
274
-
275
-
276
-
277
-
278
-
279
-
280
-
281
-
282
-
283
-
284
-
285
-
286
-
287
-
288
-
289
-
290
-
291
-
292
-
293
-
294
-
295
-
296
-
297
-
298
-
299
-
300
-
301
-
302
-
303
-
304
-
305
-
306
-
307
-
308
-
309
-
310
-
311
-
312
-
313
-
314
-
315
-
316
-
317
-
318
-
319
-
320
-
321
-
322
-
323
-
324
-
325
-
326
-
327
-
328
-
329
-
330
-
331
-
332
 |
 |
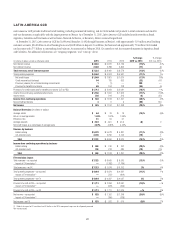
19
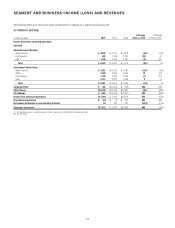
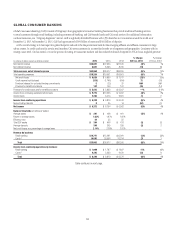
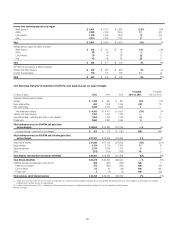
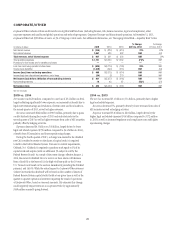
2015 vs. 2014
Net income decreased by 4% due to lower loan loss reserve releases and lower
revenues, partially offset by lower expenses and lower net credit losses.
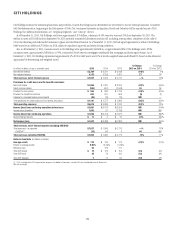
Revenues decreased 1%, reflecting lower revenues in Citi-branded cards,
partially offset by higher revenues in retail banking.
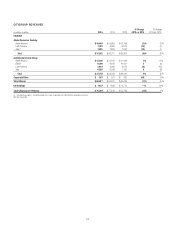
Retail banking revenues increased 6%. The increase was primarily
driven by 7% growth in average loans, 9% growth in average checking
deposits, improved deposit spreads and slightly higher mortgage origination
revenues, partially offset by lower net gains on branch sales (approximately
$40 million) and mortgage portfolio sales (approximately $80 million)
as well as a lower mortgage repurchase reserve release (approximately
$50 million) compared to 2014. This growth in retail banking revenues
occurred despite the fact that, consistent with GCB’s strategy, during 2015,
North America GCB closed or sold 69 branches (a 9% decline from the prior
year), with announced plans to sell or close an additional 50 branches in the
first quarter of 2016. With these actions, over 90% of North America GCB’s
retail banking footprint will be concentrated in its six key metropolitan areas.
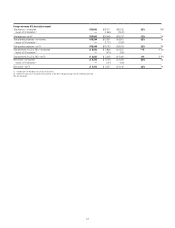
Cards revenues decreased 3% due to a 2% decline in average loans,
partially offset by a 4% increase in purchase sales. In Citi-branded cards,
revenues decreased 6%, primarily reflecting an increase in acquisition and
rewards costs, particularly during the second half of 2015 as North America
GCB deployed its investment spending (as discussed below) to grow its new
account acquisitions in its core products. North America GCB expects the
increased acquisition and rewards costs within Citi-branded cards to continue
to negatively impact revenues in 2016. The decrease in Citi-branded cards
revenues was also due to the continued impact of lower average loans (down
4%), driven primarily by continued high customer payment rates during the
year, partially offset by a 6% increase in purchase sales.
Citi retail services revenues were largely unchanged as the continued
impact of lower fuel prices, which negatively impacts purchase sales in the
fuel portfolios, and higher contractual partner payments was offset by the
impact of higher spreads and volumes (1% increase in average loans). The
higher contractual partner payments resulted from the business sharing the
benefits of higher yields and lower net credit losses with its retail partners.
Purchase sales were unchanged as the continued impact of lower fuel prices
was offset by volume growth. North America GCB expects the negative
impact of lower fuel prices on Citi retail services revenues to continue in the
near term.
Expenses decreased 5%, primarily due to ongoing cost reduction
initiatives, including as a result of the branch rationalization strategy, and
lower repositioning charges, partially offset by increased investment spending
(including marketing, among other areas) in Citi-branded cards, which is
expected to continue into 2016.
Provisions increased 15% largely due to lower net loan loss reserve
releases (73%), partially offset by lower net credit losses (11%). Net credit
losses declined in Citi-branded cards (down 14% to $1.9 billion) and in Citi
retail services (down 8% to $1.7 billion). The lower loan loss reserve release
reflected overall credit stabilization in the cards portfolios during 2015. As a
result of this stabilization, North America GCB expects to experience modest
loan loss reserve builds during 2016.
In addition to the trends discussed above expected to impact North
America GCB’s results of operations in 2016, North America GCB expects
to make additional investments in its U.S. cards businesses during 2016,
including investments in connection with Citi’s planned acquisition of
the Costco portfolio, the closing of which is currently expected to occur
mid-2016, as well as the expected impact of renewing certain important
partnership programs in a competitive environment (see also “Risk
Factors—Operational Risks” below). While North America GCB believes
these investments are necessary for the growth of its U.S. cards businesses,
they will reduce the pretax earnings of the businesses during 2016.
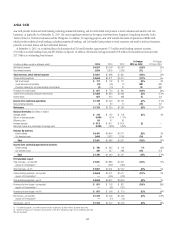
2014 vs. 2013
Net income increased by 13% due to lower net credit losses, higher loan loss
reserve releases and lower expenses, partially offset by lower revenues.
Revenues decreased 1%, with lower revenues in retail banking, partially
offset by higher revenues in Citi-branded cards and Citi retail services.
Retail banking revenues of $4.9 billion decreased 9% due to lower mortgage
origination revenues and spread compression in the deposit portfolios,
partially offset by continued volume-related growth (average loans increased
9% and average deposits increased 3%) and gains from branch sales.
Cards revenues increased 2% as average loans increased 3% versus 2013.
In Citi-branded cards, revenues increased 1% as a 4% increase in purchase
sales and higher net interest spreads, driven by the continued reduction of
promotional balances in the portfolio, mostly offset lower average loans.
The decline in average loans was driven primarily by the reduction in
promotional balances, and to a lesser extent, increased customer payment
rates during the year.
Citi retail services revenues increased 4%, primarily due to a 12% increase
in average loans driven by the Best Buy acquisition in September 2013,
partially offset by continued declines in fee revenues primarily reflecting
higher yields and improving credit and the resulting increase in contractual
partner payments. Citi retail services revenues also benefited from lower
funding costs, partially offset by a decline in net interest spreads due to a
higher percentage of promotional balances within the portfolio.
Expenses decreased 1% as ongoing cost reduction initiatives were partially
offset by higher repositioning charges, increased investment spending and
an increase in Citi retail services expenses due to the impact of the Best Buy
portfolio acquisition.
Provisions decreased 18% due to lower net credit losses (9%) and higher
loan loss reserve releases (21%). Net credit losses declined in Citi-branded
cards (down 14% to $2.2 billion) and in Citi retail services (down 2% to
$1.9 billion). The loan loss reserve release increased due to the continued
improvement in Citi-branded cards, partially offset by a lower loan loss
reserve release in Citi retail services due to reserve builds for new loans
originated in the Best Buy portfolio.