Citibank 2015 Annual Report Download - page 231
Download and view the complete annual report
Please find page 231 of the 2015 Citibank annual report below. You can navigate through the pages in the report by either clicking on the pages listed below, or by using the keyword search tool below to find specific information within the annual report.-
 1
1 -
2
-
3
-
4
-
5
-
6
-
7
-
8
-
9
-
10
-
11
-
12
-
13
-
14
-
15
-
16
-
17
-
18
-
19
-
20
-
21
-
22
-
23
-
24
-
25
-
26
-
27
-
28
-
29
-
30
-
31
-
32
-
33
-
34
-
35
-
36
-
37
-
38
-
39
-
40
-
41
-
42
-
43
-
44
-
45
-
46
-
47
-
48
-
49
-
50
-
51
-
52
-
53
-
54
-
55
-
56
-
57
-
58
-
59
-
60
-
61
-
62
-
63
-
64
-
65
-
66
-
67
-
68
-
69
-
70
-
71
-
72
-
73
-
74
-
75
-
76
-
77
-
78
-
79
-
80
-
81
-
82
-
83
-
84
-
85
-
86
-
87
-
88
-
89
-
90
-
91
-
92
-
93
-
94
-
95
-
96
-
97
-
98
-
99
-
100
-
101
-
102
-
103
-
104
-
105
-
106
-
107
-
108
-
109
-
110
-
111
-
112
-
113
-
114
-
115
-
116
-
117
-
118
-
119
-
120
-
121
-
122
-
123
-
124
-
125
-
126
-
127
-
128
-
129
-
130
-
131
-
132
-
133
-
134
-
135
-
136
-
137
-
138
-
139
-
140
-
141
-
142
-
143
-
144
-
145
-
146
-
147
-
148
-
149
-
150
-
151
-
152
-
153
-
154
-
155
-
156
-
157
-
158
-
159
-
160
-
161
-
162
-
163
-
164
-
165
-
166
-
167
-
168
-
169
-
170
-
171
-
172
-
173
-
174
-
175
-
176
-
177
-
178
-
179
-
180
-
181
-
182
-
183
-
184
-
185
-
186
-
187
-
188
-
189
-
190
-
191
-
192
-
193
-
194
-
195
-
196
-
197
-
198
-
199
-
200
-
201
-
202
-
203
-
204
-
205
-
206
-
207
-
208
-
209
-
210
-
211
-
212
-
213
-
214
-
215
-
216
-
217
-
218
-
219
-
220
-
 221
221 -
 222
222 -
 223
223 -
 224
224 -
 225
225 -
 226
226 -
 227
227 -
 228
228 -
 229
229 -
 230
230 -
 231
231 -
 232
232 -
 233
233 -
 234
234 -
 235
235 -
 236
236 -
 237
237 -
 238
238 -
 239
239 -
 240
240 -
 241
241 -
242
-
243
-
244
-
245
-
246
-
247
-
248
-
249
-
250
-
251
-
252
-
253
-
254
-
255
-
256
-
257
-
258
-
259
-
260
-
261
-
262
-
263
-
264
-
265
-
266
-
267
-
268
-
269
-
270
-
271
-
272
-
273
-
274
-
275
-
276
-
277
-
278
-
279
-
280
-
281
-
282
-
283
-
284
-
285
-
286
-
287
-
288
-
289
-
290
-
291
-
292
-
293
-
294
-
295
-
296
-
297
-
298
-
299
-
300
-
301
-
302
-
303
-
304
-
305
-
306
-
307
-
308
-
309
-
310
-
311
-
312
-
313
-
314
-
315
-
316
-
317
-
318
-
319
-
320
-
321
-
322
-
323
-
324
-
325
-
326
-
327
-
328
-
329
-
330
-
331
-
332
 |
 |

213
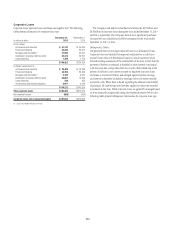
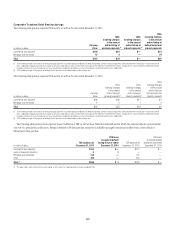
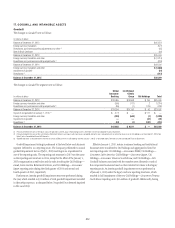
the third quarter of 2015, Citi signed definitive agreements to sell most of
its businesses reported in Citi Holdings—Consumer Latin America and
allocated $55 million of goodwill to these disposals, which are classified as
held-for-sale. This resulted in full impairment of the remaining $15 million
of goodwill within the Citi Holdings—Consumer Latin America
reporting unit.
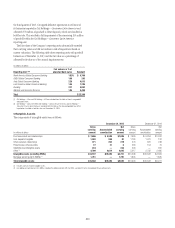
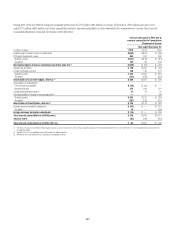
The fair values of the Company’s reporting units substantially exceeded
their carrying values and did not indicate a risk of impairment based on
current valuations. The following table shows reporting units with goodwill
balances as of December 31, 2015 and the fair value as a percentage of
allocated book value as of the annual impairment test.
In millions of dollars
Reporting Unit (1)(2)
Fair value as a % of
allocated book value Goodwill
North America Global Consumer Banking 182% $ 6,706
EMEA Global Consumer Banking 199 293
Asia Global Consumer Banking 229 4,513
Latin America Global Consumer Banking 146 1,326
Banking 237 3,052
Markets and Securities Services 145 6,459
Total $22,349
(1) Citi Holdings—Other and Citi Holdings—ICG are excluded from the table as there is no goodwill
allocated to them.
(2) Citi Holdings—Consumer EMEA, Citi Holdings—Consumer Latin America, and Citi Holdings—
Consumer Finance South Korea are excluded from the table as the allocated goodwill was either
impaired or classified as held-for-sale as of December 31, 2015.
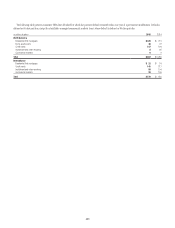
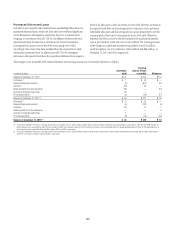
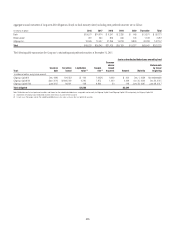
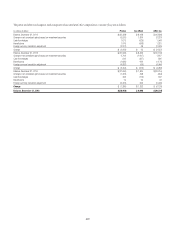
Intangible Assets
The components of intangible assets were as follows:
December 31, 2015 December 31, 2014
In millions of dollars
Gross
carrying
amount
Accumulated
amortization
Net
carrying
amount
Gross
carrying
amount
Accumulated
amortization
Net
carrying
amount
Purchased credit card relationships $ 7,606 $ 6,520 $1,086 $ 7,626 $ 6,294 $1,332
Core deposit intangibles 1,050 969 81 1,153 1,021 132
Other customer relationships 471 252 219 579 331 248
Present value of future profits 37 31 6 233 154 79
Indefinite-lived intangible assets 234 — 234 290 — 290
Other (1) 4,709 2,614 2,095 5,217 2,732 2,485
Intangible assets (excluding MSRs) $14,107 $10,386 $3,721 $15,098 $10,532 $4,566
Mortgage servicing rights (MSRs) (2) 1,781 — 1,781 1,845 — 1,845
Total intangible assets $15,888 $10,386 $5,502 $16,943 $10,532 $6,411
(1) Includes contract-related intangible assets.
(2) For additional information on Citi’s MSRs, including the rollforward from 2014 to 2015, see Note 22 to the Consolidated Financial Statements.