PNC Bank 2012 Annual Report Download - page 99
Download and view the complete annual report
Please find page 99 of the 2012 PNC Bank annual report below. You can navigate through the pages in the report by either clicking on the pages listed below, or by using the keyword search tool below to find specific information within the annual report.-
 1
1 -
2
-
3
-
4
-
5
-
6
-
7
-
8
-
9
-
10
-
11
-
12
-
13
-
14
-
15
-
16
-
17
-
18
-
19
-
20
-
21
-
22
-
23
-
24
-
25
-
26
-
27
-
28
-
29
-
30
-
31
-
32
-
33
-
34
-
35
-
36
-
37
-
38
-
39
-
40
-
41
-
42
-
43
-
44
-
45
-
46
-
47
-
48
-
49
-
50
-
51
-
52
-
53
-
54
-
55
-
56
-
57
-
58
-
59
-
60
-
61
-
62
-
63
-
64
-
65
-
66
-
67
-
68
-
69
-
70
-
71
-
72
-
73
-
74
-
75
-
76
-
77
-
78
-
79
-
80
-
81
-
82
-
83
-
84
-
85
-
86
-
87
-
88
-
 89
89 -
 90
90 -
 91
91 -
 92
92 -
 93
93 -
 94
94 -
 95
95 -
 96
96 -
 97
97 -
 98
98 -
 99
99 -
 100
100 -
 101
101 -
 102
102 -
 103
103 -
 104
104 -
 105
105 -
 106
106 -
 107
107 -
 108
108 -
 109
109 -
110
-
111
-
112
-
113
-
114
-
115
-
116
-
117
-
118
-
119
-
120
-
121
-
122
-
123
-
124
-
125
-
126
-
127
-
128
-
129
-
130
-
131
-
132
-
133
-
134
-
135
-
136
-
137
-
138
-
139
-
140
-
141
-
142
-
143
-
144
-
145
-
146
-
147
-
148
-
149
-
150
-
151
-
152
-
153
-
154
-
155
-
156
-
157
-
158
-
159
-
160
-
161
-
162
-
163
-
164
-
165
-
166
-
167
-
168
-
169
-
170
-
171
-
172
-
173
-
174
-
175
-
176
-
177
-
178
-
179
-
180
-
181
-
182
-
183
-
184
-
185
-
186
-
187
-
188
-
189
-
190
-
191
-
192
-
193
-
194
-
195
-
196
-
197
-
198
-
199
-
200
-
201
-
202
-
203
-
204
-
205
-
206
-
207
-
208
-
209
-
210
-
211
-
212
-
213
-
214
-
215
-
216
-
217
-
218
-
219
-
220
-
221
-
222
-
223
-
224
-
225
-
226
-
227
-
228
-
229
-
230
-
231
-
232
-
233
-
234
-
235
-
236
-
237
-
238
-
239
-
240
-
241
-
242
-
243
-
244
-
245
-
246
-
247
-
248
-
249
-
250
-
251
-
252
-
253
-
254
-
255
-
256
-
257
-
258
-
259
-
260
-
261
-
262
-
263
-
264
-
265
-
266
-
267
-
268
-
269
-
270
-
271
-
272
-
273
-
274
-
275
-
276
-
277
-
278
-
279
-
280
 |
 |

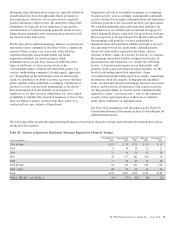
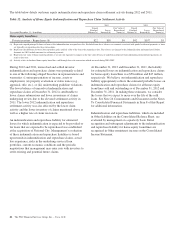
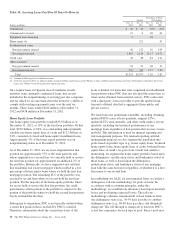
Table 29: Analysis of Quarterly Residential Mortgage Unresolved Asserted Indemnification and Repurchase Claims
Dollars in millions
December 31
2012
September 30
2012
June 30
2012
March 31
2012
December 31
2011
FNMA, FHLMC, and GNMA Securitizations $290 $430 $419 $337 $302
Private Investors (a) 47 82 83 69 73
Total unresolved claims $337 $512 $502 $406 $375
FNMA, FHLMC, and GNMA % 86% 84% 83% 83% 81%
(a) Activity relates to loans sold through Non-agency securitization and loan sale transactions.
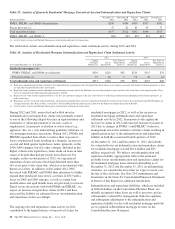
The table below details our indemnification and repurchase claim settlement activity during 2012 and 2011.
Table 30: Analysis of Residential Mortgage Indemnification and Repurchase Claim Settlement Activity
2012 2011
Year ended December 31 – In millions
Unpaid
Principal
Balance (a)
Losses
Incurred (b)
Fair Value of
Repurchased
Loans (c)
Unpaid
Principal
Balance (a)
Losses
Incurred (b)
Fair Value of
Repurchased
Loans (c)
Residential mortgages (d):
FNMA, FHLMC, and GNMA securitizations $356 $210 $85 $220 $115 $74
Private investors (e) 75 46 5 76 48 14
Total indemnification and repurchase settlements $431 $256 $90 $296 $163 $88
(a) Represents unpaid principal balance of loans at the indemnification or repurchase date. Excluded from these balances are amounts associated with pooled settlement payments as loans
are typically not repurchased in these transactions.
(b) Represents both i) amounts paid for indemnification/settlement payments and ii) the difference between loan repurchase price and fair value of the loan at the repurchase date. These
losses are charged to the indemnification and repurchase liability.
(c) Represents fair value of loans repurchased only as we have no exposure to changes in the fair value of loans or underlying collateral when indemnification/settlement payments are
made to investors.
(d) Repurchase activity associated with insured loans, government-guaranteed loans, and loans repurchased through the exercise of our removal of account provision (ROAP) option are
excluded from this table. Refer to Note 3 in the Notes To Consolidated Financial Statements in Item 8 of this Report for further discussion of ROAPs.
(e) Activity relates to loans sold through Non-agency securitizations and loan sale transactions.
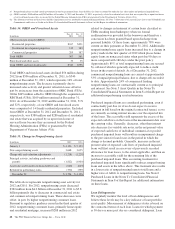
During 2012 and 2011, unresolved and settled investor
indemnification and repurchase claims were primarily related
to one of the following alleged breaches in representations and
warranties: (i) misrepresentation of income, assets or
employment, (ii) property evaluation or status issues (e.g.,
appraisal, title, etc.), (iii) underwriting guideline violations, or
(iv) mortgage insurance rescissions. During 2012, FNMA and
FHLMC expanded their efforts to reduce their exposure to
losses on purchased loans resulting in a dramatic increase in
second and third quarter repurchase claims, primarily on the
2006-2008 vintages, but also other vintages. Included in this
higher volume were repurchase claims made on loans in later
stages of default than had previously been observed. For
example, in the second quarter of 2012, we experienced
repurchase claims on loans which had defaulted more than
two years prior to the claim date, which was inconsistent with
historical activity. In addition, in December 2012, PNC
discussed with FHLMC and FNMA their intentions to further
expand their purchased loan review activities in 2013 with a
focus on 2004 and 2005 vintages, as well as certain loan
modifications and aged default loans not previously reviewed.
Based on our discussions with both FNMA and FHLMC, we
expect an increase in repurchase claims in 2013 and have
increased the liability for estimated losses on indemnification
and repurchase claims accordingly.
The ongoing elevated repurchase claim activity in 2012
contributed to the higher balance of unresolved claims for
residential mortgages in 2012, as well as the increase in
residential mortgage indemnification and repurchase
settlement activity in 2012. In response to the significant
increase in claims in 2012 and expected increase in claims in
2013 due to changes in FNMA’s and FHLMC’s behavior,
management revised its estimates of future claims resulting in
significant increases to the indemnification and repurchase
liability in both the second and fourth quarters of 2012.
At December 31, 2012 and December 31, 2011, the liability
for estimated losses on indemnification and repurchase claims
for residential mortgages totaled $614 million and $83
million, respectively. We believe our indemnification and
repurchase liability appropriately reflects the estimated
probable losses on indemnification and repurchase claims for
all residential mortgage loans sold and outstanding as of
December 31, 2012 and December 31, 2011. In making these
estimates, we consider the losses that we expect to incur over
the life of the sold loans. See Note 24 Commitments and
Guarantees in the Notes To Consolidated Financial Statements
in Item 8 of this Report for additional information.
Indemnification and repurchase liabilities, which are included
in Other liabilities on the Consolidated Balance Sheet, are
initially recognized when loans are sold to investors and are
subsequently evaluated by management. Initial recognition
and subsequent adjustments to the indemnification and
repurchase liability for the sold residential mortgage portfolio
are recognized in Residential mortgage revenue on the
Consolidated Income Statement.
80 The PNC Financial Services Group, Inc. – Form 10-K