PNC Bank 2012 Annual Report Download - page 175
Download and view the complete annual report
Please find page 175 of the 2012 PNC Bank annual report below. You can navigate through the pages in the report by either clicking on the pages listed below, or by using the keyword search tool below to find specific information within the annual report.-
 1
1 -
2
-
3
-
4
-
5
-
6
-
7
-
8
-
9
-
10
-
11
-
12
-
13
-
14
-
15
-
16
-
17
-
18
-
19
-
20
-
21
-
22
-
23
-
24
-
25
-
26
-
27
-
28
-
29
-
30
-
31
-
32
-
33
-
34
-
35
-
36
-
37
-
38
-
39
-
40
-
41
-
42
-
43
-
44
-
45
-
46
-
47
-
48
-
49
-
50
-
51
-
52
-
53
-
54
-
55
-
56
-
57
-
58
-
59
-
60
-
61
-
62
-
63
-
64
-
65
-
66
-
67
-
68
-
69
-
70
-
71
-
72
-
73
-
74
-
75
-
76
-
77
-
78
-
79
-
80
-
81
-
82
-
83
-
84
-
85
-
86
-
87
-
88
-
89
-
90
-
91
-
92
-
93
-
94
-
95
-
96
-
97
-
98
-
99
-
100
-
101
-
102
-
103
-
104
-
105
-
106
-
107
-
108
-
109
-
110
-
111
-
112
-
113
-
114
-
115
-
116
-
117
-
118
-
119
-
120
-
121
-
122
-
123
-
124
-
125
-
126
-
127
-
128
-
129
-
130
-
131
-
132
-
133
-
134
-
135
-
136
-
137
-
138
-
139
-
140
-
141
-
142
-
143
-
144
-
145
-
146
-
147
-
148
-
149
-
150
-
151
-
152
-
153
-
154
-
155
-
156
-
157
-
158
-
159
-
160
-
161
-
162
-
163
-
164
-
 165
165 -
 166
166 -
 167
167 -
 168
168 -
 169
169 -
 170
170 -
 171
171 -
 172
172 -
 173
173 -
 174
174 -
 175
175 -
 176
176 -
 177
177 -
 178
178 -
 179
179 -
 180
180 -
 181
181 -
 182
182 -
 183
183 -
 184
184 -
 185
185 -
186
-
187
-
188
-
189
-
190
-
191
-
192
-
193
-
194
-
195
-
196
-
197
-
198
-
199
-
200
-
201
-
202
-
203
-
204
-
205
-
206
-
207
-
208
-
209
-
210
-
211
-
212
-
213
-
214
-
215
-
216
-
217
-
218
-
219
-
220
-
221
-
222
-
223
-
224
-
225
-
226
-
227
-
228
-
229
-
230
-
231
-
232
-
233
-
234
-
235
-
236
-
237
-
238
-
239
-
240
-
241
-
242
-
243
-
244
-
245
-
246
-
247
-
248
-
249
-
250
-
251
-
252
-
253
-
254
-
255
-
256
-
257
-
258
-
259
-
260
-
261
-
262
-
263
-
264
-
265
-
266
-
267
-
268
-
269
-
270
-
271
-
272
-
273
-
274
-
275
-
276
-
277
-
278
-
279
-
280
 |
 |

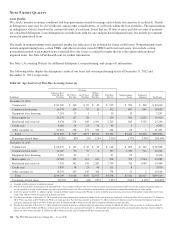
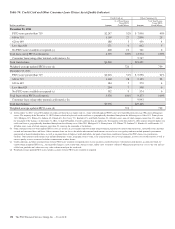
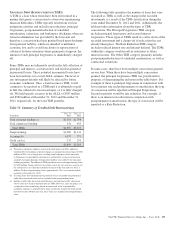
Table 72: Financial Impact and TDRs by Concession Type (a)
Post-TDR Recorded Investment (c)
During the year ended December 31, 2012
Dollars in millions
Number
of Loans
Pre-TDR
Recorded
Investment (b)
Principal
Forgiveness
Rate
Reduction Other Total
Commercial lending
Commercial 212 $ 355 $ 13 $ 90 $198 $ 301
Commercial real estate 67 201 23 43 118 184
Equipment lease financing 10 24 2 2 12 16
Total commercial lending 289 580 38 135 328 501
Consumer lending
Home equity 4,813 313 200 110 310
Residential real estate 754 147 60 83 143
Credit card 13,306 93 90 90
Other consumer 835 20 2 19 21
Total consumer lending 19,708 573 352 212 564
Total TDRs 19,997 $1,153 $ 38 $487 $540 $1,065
During the year ended December 31, 2011 (e)
Dollars in millions
Commercial lending
Commercial 599 $ 129 $ 19 $ 33 $ 60 $ 112
Commercial real estate 78 286 83 123 54 260
Equipment lease financing (d) 2 1
Total commercial lending 679 416 102 156 114 372
Consumer lending
Home equity 4,013 321 281 39 320
Residential real estate 1,590 376 236 115 351
Credit card 11,761 87 84 84
Other consumer 472 13 1 12 13
Total consumer lending 17,836 797 602 166 768
Total TDRs 18,515 $1,213 $102 $758 $280 $1,140
(a) Impact of partial charge-offs at TDR date are included in this table.
(b) Represents the recorded investment of the loans as of the quarter end prior to the TDR designation, and excludes immaterial amounts of accrued interest receivable.
(c) Represents the recorded investment of the TDRs as of the quarter end the TDR occurs, and excludes immaterial amounts of accrued interest receivable.
(d) During 2011, the Post-TDR amounts for the Equipment lease financing loan class total less than $1 million.
(e) Includes loans modified during 2011 that were determined to be TDRs under the requirements of ASU 2011-02, which was adopted on July 1, 2011 and prospectively applied to all
modifications entered into on and after January 1, 2011.
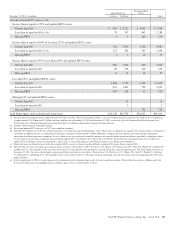
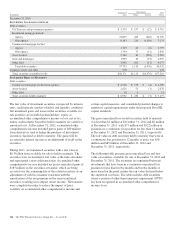
TDRs may result in charge-offs and interest income not being
recognized. At or around the time of modification, there was
$22 million in recorded investment of commercial TDRs, $10
million in recorded investment of commercial real estate
TDRs and $5 million of equipment lease financing TDRs
charged off during 2012. Comparable amounts for 2011 were
$26 million, $15 million and zero respectively. For residential
real estate TDRs, there was $7 million of recorded investment
charged off during 2012, related to modifications in which
principal was partially deferred and deemed uncollectible. The
comparable amount for 2011 was $17 million. Charge-offs
around the time of modification related to home equity, credit
card, and other consumer TDR portfolios were immaterial for
both periods.
A financial effect of rate reduction TDRs is that interest
income is not recognized. Interest income not recognized that
otherwise would have been earned in the year ended
December 31, 2012 and 2011 related to both commercial
TDRs and consumer TDRs was not material.
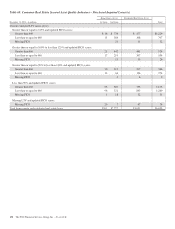
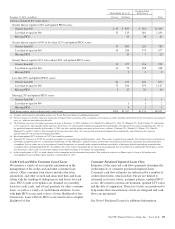
Pursuant to regulatory guidance issued in the third quarter of
2012, management compiled TDR information related to
changes in treatment of certain loans where a borrower has
been discharged from personal liability in bankruptcy and has
not formally reaffirmed its loan obligation to PNC. This
information has been reflected in period end balance
disclosures for the year ended December 31, 2012. Because of
the timing of the compilation of the TDR information and the
fact that it covers several periods, $366 million of TDRs, net
of $128.1 million of charge-offs, related to this new regulatory
guidance, has not been reflected as part of 2012 activity
included in Table 72: Financial Impact and TDRs by
Concession Type and Table 73: TDRs which have
Subsequently Defaulted.
156 The PNC Financial Services Group, Inc. – Form 10-K