PNC Bank 2012 Annual Report Download - page 70
Download and view the complete annual report
Please find page 70 of the 2012 PNC Bank annual report below. You can navigate through the pages in the report by either clicking on the pages listed below, or by using the keyword search tool below to find specific information within the annual report.-
 1
1 -
2
-
3
-
4
-
5
-
6
-
7
-
8
-
9
-
10
-
11
-
12
-
13
-
14
-
15
-
16
-
17
-
18
-
19
-
20
-
21
-
22
-
23
-
24
-
25
-
26
-
27
-
28
-
29
-
30
-
31
-
32
-
33
-
34
-
35
-
36
-
37
-
38
-
39
-
40
-
41
-
42
-
43
-
44
-
45
-
46
-
47
-
48
-
49
-
50
-
51
-
52
-
53
-
54
-
55
-
56
-
57
-
58
-
59
-
 60
60 -
 61
61 -
 62
62 -
 63
63 -
 64
64 -
 65
65 -
 66
66 -
 67
67 -
 68
68 -
 69
69 -
 70
70 -
 71
71 -
 72
72 -
 73
73 -
 74
74 -
 75
75 -
 76
76 -
 77
77 -
 78
78 -
 79
79 -
 80
80 -
81
-
82
-
83
-
84
-
85
-
86
-
87
-
88
-
89
-
90
-
91
-
92
-
93
-
94
-
95
-
96
-
97
-
98
-
99
-
100
-
101
-
102
-
103
-
104
-
105
-
106
-
107
-
108
-
109
-
110
-
111
-
112
-
113
-
114
-
115
-
116
-
117
-
118
-
119
-
120
-
121
-
122
-
123
-
124
-
125
-
126
-
127
-
128
-
129
-
130
-
131
-
132
-
133
-
134
-
135
-
136
-
137
-
138
-
139
-
140
-
141
-
142
-
143
-
144
-
145
-
146
-
147
-
148
-
149
-
150
-
151
-
152
-
153
-
154
-
155
-
156
-
157
-
158
-
159
-
160
-
161
-
162
-
163
-
164
-
165
-
166
-
167
-
168
-
169
-
170
-
171
-
172
-
173
-
174
-
175
-
176
-
177
-
178
-
179
-
180
-
181
-
182
-
183
-
184
-
185
-
186
-
187
-
188
-
189
-
190
-
191
-
192
-
193
-
194
-
195
-
196
-
197
-
198
-
199
-
200
-
201
-
202
-
203
-
204
-
205
-
206
-
207
-
208
-
209
-
210
-
211
-
212
-
213
-
214
-
215
-
216
-
217
-
218
-
219
-
220
-
221
-
222
-
223
-
224
-
225
-
226
-
227
-
228
-
229
-
230
-
231
-
232
-
233
-
234
-
235
-
236
-
237
-
238
-
239
-
240
-
241
-
242
-
243
-
244
-
245
-
246
-
247
-
248
-
249
-
250
-
251
-
252
-
253
-
254
-
255
-
256
-
257
-
258
-
259
-
260
-
261
-
262
-
263
-
264
-
265
-
266
-
267
-
268
-
269
-
270
-
271
-
272
-
273
-
274
-
275
-
276
-
277
-
278
-
279
-
280
 |
 |

C
APITAL
We manage our capital position by making adjustments to our
balance sheet size and composition, issuing debt, equity or
other capital instruments, executing treasury stock transactions
and capital redemptions, managing dividend policies and
retaining earnings.
Total shareholders’ equity increased $5.0 billion, to $39.0
billion at December 31, 2012 compared with December 31,
2011, reflecting an increase in retained earnings of $2.0 billion
and the issuance of $480 million of preferred stock in
September and October 2012 and $1.5 billion in April 2012.
This contributed to the increase in capital surplus – preferred
stock from $1.6 billion at December 31, 2011 to $3.6 billion at
December 31, 2012. Accumulated other comprehensive
income increased $.9 billion, to $.8 billion, at December 31,
2012 compared with a loss of $.1 billion at December 31,
2011 due to higher net unrealized gains on securities, partially
offset by lower unrealized gains on cash flow hedge
derivatives. Common shares outstanding were 528 million at
December 31, 2012 and 527 million at December 31, 2011.
Our current common stock repurchase program permits us to
purchase up to 25 million shares of PNC common stock on the
open market or in privately negotiated transactions. This
program will remain in effect until fully utilized or until
modified, superseded or terminated. The extent and timing of
share repurchases under this program will depend on a number
of factors including, among others, market and general
economic conditions, economic and regulatory capital
considerations, alternative uses of capital, and the potential
impact on our credit ratings. Consistent with our capital plan
submitted to the Federal Reserve in the first quarter of 2012,
PNC purchased $190 million of common stock in 2012 under
a $250 million authorization for 2012 as part of its existing
25 million share repurchase program in open market or
privately negotiated transactions. During 2013, management
does not expect to repurchase any common stock under this
repurchase program. See “Supervision and Regulation” in
Item 1 of this Report for further information concerning
restrictions on dividends and stock repurchases, including the
impact of the Federal Reserve’s current supervisory
assessment of capital adequacy program, which is also
discussed in the Capital and Liquidity Actions portion of the
Executive Summary section of this Item 7.
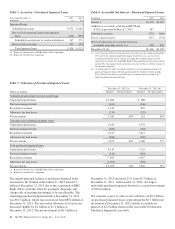
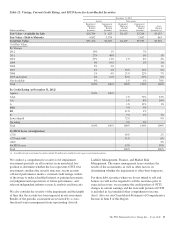
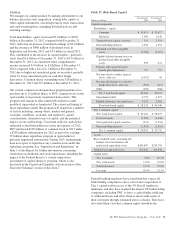
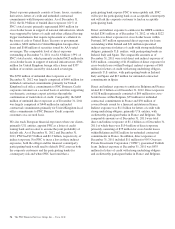
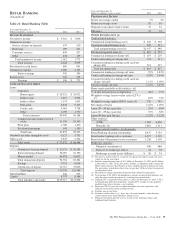
Table 17: Risk-Based Capital
Dollars in millions
December 31
2012
December 31
2011
Capital components
Shareholders’ equity
Common $ 35,413 $ 32,417
Preferred 3,590 1,636
Trust preferred capital securities 331 2,354
Noncontrolling interests 1,354 1,351
Goodwill and other intangible
assets (9,798) (9,027)
Eligible deferred income taxes on
goodwill and other intangible
assets 354 431
Pension, other postretirement
benefit plan adjustments 777 755
Net unrealized securities (gains)/
losses, after-tax (1,052) 41
Net unrealized gains on cash flow
hedge derivatives, after-tax (578) (717)
Other (165) (168)
Tier 1 risk-based capital 30,226 29,073
Subordinated debt 4,735 4,571
Eligible allowance for credit losses 3,273 2,904
Total risk-based capital $ 38,234 $ 36,548
Tier 1 common capital
Tier 1 risk-based capital $ 30,226 $ 29,073
Preferred equity (3,590) (1,636)
Trust preferred capital securities (331) (2,354)
Noncontrolling interests (1,354) (1,351)
Tier 1 common capital $ 24,951 $ 23,732
Assets
Risk-weighted assets, including off-
balance sheet instruments and
market risk equivalent assets $260,847 $230,705
Adjusted average total assets 291,426 261,958
Capital ratios
Tier 1 common 9.6% 10.3%
Tier 1 risk-based 11.6% 12.6%
Total risk-based 14.7% 15.8%
Leverage 10.4% 11.1%
Federal banking regulators have stated that they expect all
bank holding companies to have a level and composition of
Tier 1 capital well in excess of the 4% Basel I regulatory
minimum, and they have required the largest US bank holding
companies, including PNC, to have a capital buffer sufficient
to withstand losses and allow them to meet credit needs of
their customers through estimated stress scenarios. They have
also stated their view that common equity should be the
The PNC Financial Services Group, Inc. – Form 10-K 51