PNC Bank 2012 Annual Report Download - page 64
Download and view the complete annual report
Please find page 64 of the 2012 PNC Bank annual report below. You can navigate through the pages in the report by either clicking on the pages listed below, or by using the keyword search tool below to find specific information within the annual report.-
 1
1 -
2
-
3
-
4
-
5
-
6
-
7
-
8
-
9
-
10
-
11
-
12
-
13
-
14
-
15
-
16
-
17
-
18
-
19
-
20
-
21
-
22
-
23
-
24
-
25
-
26
-
27
-
28
-
29
-
30
-
31
-
32
-
33
-
34
-
35
-
36
-
37
-
38
-
39
-
40
-
41
-
42
-
43
-
44
-
45
-
46
-
47
-
48
-
49
-
50
-
51
-
52
-
53
-
 54
54 -
 55
55 -
 56
56 -
 57
57 -
 58
58 -
 59
59 -
 60
60 -
 61
61 -
 62
62 -
 63
63 -
 64
64 -
 65
65 -
 66
66 -
 67
67 -
 68
68 -
 69
69 -
 70
70 -
 71
71 -
 72
72 -
 73
73 -
 74
74 -
75
-
76
-
77
-
78
-
79
-
80
-
81
-
82
-
83
-
84
-
85
-
86
-
87
-
88
-
89
-
90
-
91
-
92
-
93
-
94
-
95
-
96
-
97
-
98
-
99
-
100
-
101
-
102
-
103
-
104
-
105
-
106
-
107
-
108
-
109
-
110
-
111
-
112
-
113
-
114
-
115
-
116
-
117
-
118
-
119
-
120
-
121
-
122
-
123
-
124
-
125
-
126
-
127
-
128
-
129
-
130
-
131
-
132
-
133
-
134
-
135
-
136
-
137
-
138
-
139
-
140
-
141
-
142
-
143
-
144
-
145
-
146
-
147
-
148
-
149
-
150
-
151
-
152
-
153
-
154
-
155
-
156
-
157
-
158
-
159
-
160
-
161
-
162
-
163
-
164
-
165
-
166
-
167
-
168
-
169
-
170
-
171
-
172
-
173
-
174
-
175
-
176
-
177
-
178
-
179
-
180
-
181
-
182
-
183
-
184
-
185
-
186
-
187
-
188
-
189
-
190
-
191
-
192
-
193
-
194
-
195
-
196
-
197
-
198
-
199
-
200
-
201
-
202
-
203
-
204
-
205
-
206
-
207
-
208
-
209
-
210
-
211
-
212
-
213
-
214
-
215
-
216
-
217
-
218
-
219
-
220
-
221
-
222
-
223
-
224
-
225
-
226
-
227
-
228
-
229
-
230
-
231
-
232
-
233
-
234
-
235
-
236
-
237
-
238
-
239
-
240
-
241
-
242
-
243
-
244
-
245
-
246
-
247
-
248
-
249
-
250
-
251
-
252
-
253
-
254
-
255
-
256
-
257
-
258
-
259
-
260
-
261
-
262
-
263
-
264
-
265
-
266
-
267
-
268
-
269
-
270
-
271
-
272
-
273
-
274
-
275
-
276
-
277
-
278
-
279
-
280
 |
 |

W
EIGHTED
A
VERAGE
L
IFE OF THE
P
URCHASED
I
MPAIRED
P
ORTFOLIOS
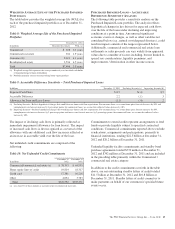
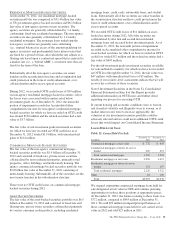
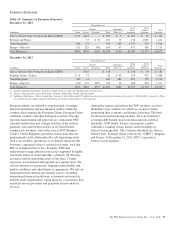
The table below provides the weighted average life (WAL) for
each of the purchased impaired portfolios as of December 31,
2012.
Table 8: Weighted Average Life of the Purchased Impaired
Portfolios
December 31, 2012
In millions Recorded Investment WAL (a)
Commercial $ 308 2.1 years
Commercial real estate 941 1.9 years
Consumer (b) 2,621 4.1 years
Residential real estate 3,536 4.5 years
Total $7,406 3.9 years
(a) Weighted average life represents the average number of years for which each dollar
of unpaid principal remains outstanding.
(b) Portfolio primarily consists of nonrevolving home equity products.
P
URCHASED
I
MPAIRED
L
OANS
–A
CCRETABLE
D
IFFERENCE
S
ENSITIVITY
A
NALYSIS
The following table provides a sensitivity analysis on the
Purchased Impaired Loans portfolio. The analysis reflects
hypothetical changes in key drivers for expected cash flows
over the life of the loans under declining and improving
conditions at a point in time. Any unusual significant
economic events or changes, as well as other variables not
considered below (e.g., natural or widespread disasters), could
result in impacts outside of the ranges represented below.
Additionally, commercial and commercial real estate loan
settlements or sales proceeds can vary widely from appraised
values due to a number of factors including, but not limited to,
special use considerations, liquidity premiums, and
improvements / deterioration in other income sources.
Table 9: Accretable Difference Sensitivity – Total Purchased Impaired Loans
In billions December 31, 2012 Declining Scenario (a) Improving Scenario (b)
Expected Cash Flows $ 8.5 $(.4) $.5
Accretable Difference 2.2 (.1) .3
Allowance for Loan and Lease Losses (1.1) (.4) .2
(a) Declining Scenario – Reflects hypothetical changes that would decrease future cash flow expectations. For consumer loans, we assume home price forecast decreases by 10% and
unemployment rate forecast increases by 2 percentage points; for commercial loans, we assume that collateral values decrease by 10%.
(b) Improving Scenario – Reflects hypothetical changes that would increase future cash flow expectations. For consumer loans, we assume home price forecast increases by 10%,
unemployment rate forecast decreases by 2 percentage points and interest rate forecast increases by 2 percentage points; for commercial loans, we assume that collateral values
increase by 10%.
The impact of declining cash flows is primarily reflected as
immediate impairment (allowance for loan losses). The impact
of increased cash flows is first recognized as a reversal of the
allowance with any additional cash flow increases reflected as
an increase in accretable yield over the life of the loan.
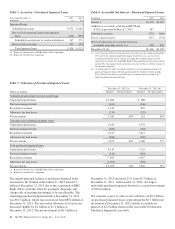
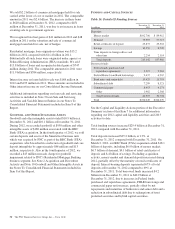
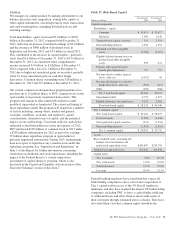
Net unfunded credit commitments are comprised of the
following:
Table 10: Net Unfunded Credit Commitments
In millions
December 31
2012
December 31
2011
Commercial/commercial real estate (a) $ 78,703 $ 64,955
Home equity lines of credit 19,814 18,317
Credit card 17,381 16,216
Other 4,694 3,783
Total $120,592 $103,271
(a) Less than 5% of these amounts at each date relate to commercial real estate.
Commitments to extend credit represent arrangements to lend
funds or provide liquidity subject to specified contractual
conditions. Commercial commitments reported above exclude
syndications, assignments and participations, primarily to
financial institutions, totaling $22.5 billion at December 31,
2012 and $20.2 billion at December 31, 2011.
Unfunded liquidity facility commitments and standby bond
purchase agreements totaled $732 million at December 31,
2012 and $742 million at December 31, 2011 and are included
in the preceding table primarily within the Commercial /
commercial real estate category.
In addition to the credit commitments set forth in the table
above, our net outstanding standby letters of credit totaled
$11.5 billion at December 31, 2012 and $10.8 billion at
December 31, 2011. Standby letters of credit commit us to
make payments on behalf of our customers if specified future
events occur.
The PNC Financial Services Group, Inc. – Form 10-K 45