PNC Bank 2012 Annual Report Download - page 167
Download and view the complete annual report
Please find page 167 of the 2012 PNC Bank annual report below. You can navigate through the pages in the report by either clicking on the pages listed below, or by using the keyword search tool below to find specific information within the annual report.-
 1
1 -
2
-
3
-
4
-
5
-
6
-
7
-
8
-
9
-
10
-
11
-
12
-
13
-
14
-
15
-
16
-
17
-
18
-
19
-
20
-
21
-
22
-
23
-
24
-
25
-
26
-
27
-
28
-
29
-
30
-
31
-
32
-
33
-
34
-
35
-
36
-
37
-
38
-
39
-
40
-
41
-
42
-
43
-
44
-
45
-
46
-
47
-
48
-
49
-
50
-
51
-
52
-
53
-
54
-
55
-
56
-
57
-
58
-
59
-
60
-
61
-
62
-
63
-
64
-
65
-
66
-
67
-
68
-
69
-
70
-
71
-
72
-
73
-
74
-
75
-
76
-
77
-
78
-
79
-
80
-
81
-
82
-
83
-
84
-
85
-
86
-
87
-
88
-
89
-
90
-
91
-
92
-
93
-
94
-
95
-
96
-
97
-
98
-
99
-
100
-
101
-
102
-
103
-
104
-
105
-
106
-
107
-
108
-
109
-
110
-
111
-
112
-
113
-
114
-
115
-
116
-
117
-
118
-
119
-
120
-
121
-
122
-
123
-
124
-
125
-
126
-
127
-
128
-
129
-
130
-
131
-
132
-
133
-
134
-
135
-
136
-
137
-
138
-
139
-
140
-
141
-
142
-
143
-
144
-
145
-
146
-
147
-
148
-
149
-
150
-
151
-
152
-
153
-
154
-
155
-
156
-
 157
157 -
 158
158 -
 159
159 -
 160
160 -
 161
161 -
 162
162 -
 163
163 -
 164
164 -
 165
165 -
 166
166 -
 167
167 -
 168
168 -
 169
169 -
 170
170 -
 171
171 -
 172
172 -
 173
173 -
 174
174 -
 175
175 -
 176
176 -
 177
177 -
178
-
179
-
180
-
181
-
182
-
183
-
184
-
185
-
186
-
187
-
188
-
189
-
190
-
191
-
192
-
193
-
194
-
195
-
196
-
197
-
198
-
199
-
200
-
201
-
202
-
203
-
204
-
205
-
206
-
207
-
208
-
209
-
210
-
211
-
212
-
213
-
214
-
215
-
216
-
217
-
218
-
219
-
220
-
221
-
222
-
223
-
224
-
225
-
226
-
227
-
228
-
229
-
230
-
231
-
232
-
233
-
234
-
235
-
236
-
237
-
238
-
239
-
240
-
241
-
242
-
243
-
244
-
245
-
246
-
247
-
248
-
249
-
250
-
251
-
252
-
253
-
254
-
255
-
256
-
257
-
258
-
259
-
260
-
261
-
262
-
263
-
264
-
265
-
266
-
267
-
268
-
269
-
270
-
271
-
272
-
273
-
274
-
275
-
276
-
277
-
278
-
279
-
280
 |
 |
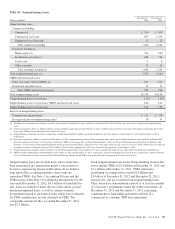
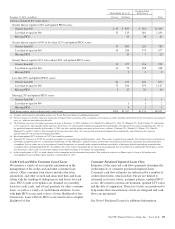
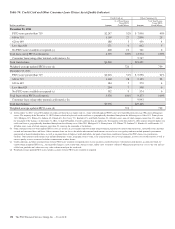
Additional Asset Quality Indicators
We have two overall portfolio segments – Commercial
Lending and Consumer Lending. Each of these two segments
is comprised of one or more loan classes. Classes are
characterized by similarities in initial measurement, risk
attributes and the manner in which we monitor and assess
credit risk. The commercial segment is comprised of the
commercial, commercial real estate, equipment lease
financing, and commercial purchased impaired loan classes.
The consumer segment is comprised of the home equity,
residential real estate, credit card, other consumer, and
consumer purchased impaired loan classes. Asset quality
indicators for each of these loan classes are discussed in more
detail below.
C
OMMERCIAL
L
ENDING
A
SSET
C
LASSES
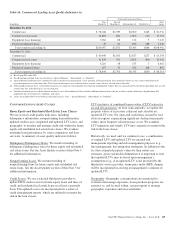
Commercial Loan Class
For commercial loans, we monitor the performance of the
borrower in a disciplined and regular manner based upon the
level of credit risk inherent in the loan. To evaluate the level
of credit risk, we assign internal risk ratings reflecting the
borrower’s PD and LGD. This two-dimensional credit risk
rating methodology provides risk granularity in the monitoring
process on an ongoing basis. These ratings are reviewed and
updated on a risk-adjusted basis, generally at least once per
year. Additionally, on an annual basis, we update PD rates
related to each rating grade based upon internal historical data,
augmented by market data. For small balance homogenous
pools of commercial loans, mortgages and leases, we apply
statistical modeling to assist in determining the probability of
default within these pools. Further, on a periodic basis, we
update our LGD estimates associated with each rating grade
based on historical data. The combination of the PD and LGD
ratings assigned to a commercial loan, capturing both the
expectations of default and loss severity in event of default,
reflects the relative estimated likelihood of loss for that loan at
the reporting date. In general, loans with better PD and LGD
have a lower likelihood of loss. Conversely, loans with worse
PD and LGD have a higher likelihood of loss. The loss
amount also considers exposure at date of default (EAD),
which we also periodically update based on historical data.
Based upon the amount of exposure and our risk ratings, we
follow a formal schedule of written periodic review. On a
quarterly basis, we conduct formal reviews of a market or
business unit’s loan portfolio, focusing on those loans which
we perceive to be of higher risk, based upon PDs and LGDs,
or weakening credit quality. If circumstances warrant, it is our
practice to review any customer obligation and its level of
credit risk more frequently. We attempt to proactively manage
our loans by using various procedures that are customized to
the risk of a given loan, including ongoing outreach, contact,
and assessment of obligor financial conditions, collateral
inspection and appraisal.
Commercial Real Estate Loan Class
We manage credit risk associated with our commercial real
estate projects and commercial mortgage activities similar to
commercial loans by analyzing PD and LGD. Additionally,
risks connected with commercial real estate projects and
commercial mortgage activities tend to be correlated to the
loan structure and collateral location, project progress and
business environment. As a result, these attributes are also
monitored and utilized in assessing credit risk.
As with the commercial class, a formal schedule of periodic
review is performed to also assess market/geographic risk and
business unit/industry risk. Often as a result of these
overviews, more in-depth reviews and increased scrutiny are
placed on areas of higher risk, including adverse changes in
risk ratings, deteriorating operating trends, and/or areas that
concern management. The goal of these reviews is to assess
risk and take actions to mitigate our exposure to such risks.
Equipment Lease Financing Loan Class
We manage credit risk associated with our equipment lease
financing class similar to commercial loans by analyzing PD
and LGD.
Based upon the dollar amount of the lease and of the level of
credit risk, we follow a formal schedule of periodic review.
Generally, this occurs on a quarterly basis, although we have
established practices to review such credit risk more
frequently, if circumstances warrant. Our review process
entails analysis of the following factors: equipment value/
residual value, exposure levels, jurisdiction risk, industry risk,
and guarantor requirements.
Commercial Purchased Impaired Loans Class
The credit impacts of purchased impaired loans are primarily
determined through the estimation of expected cash flows.
Commercial cash flow estimates are influenced by a number
of credit related items, which include but are not limited to:
estimated collateral values, receipt of additional collateral,
secondary trading prices, circumstances of possible and/or
ongoing liquidation, capital availability, business operations
and payment patterns.
We attempt to proactively manage these factors by using
various procedures that are customized to the risk of a given
loan. These procedures include a review by our Special Asset
Committee (SAC), ongoing outreach, contact, and assessment
of obligor financial conditions, collateral inspection and
appraisal.
See Note 6 Purchased Loans for additional information.
148 The PNC Financial Services Group, Inc. – Form 10-K