PNC Bank 2012 Annual Report Download - page 68
Download and view the complete annual report
Please find page 68 of the 2012 PNC Bank annual report below. You can navigate through the pages in the report by either clicking on the pages listed below, or by using the keyword search tool below to find specific information within the annual report.-
 1
1 -
2
-
3
-
4
-
5
-
6
-
7
-
8
-
9
-
10
-
11
-
12
-
13
-
14
-
15
-
16
-
17
-
18
-
19
-
20
-
21
-
22
-
23
-
24
-
25
-
26
-
27
-
28
-
29
-
30
-
31
-
32
-
33
-
34
-
35
-
36
-
37
-
38
-
39
-
40
-
41
-
42
-
43
-
44
-
45
-
46
-
47
-
48
-
49
-
50
-
51
-
52
-
53
-
54
-
55
-
56
-
57
-
 58
58 -
 59
59 -
 60
60 -
 61
61 -
 62
62 -
 63
63 -
 64
64 -
 65
65 -
 66
66 -
 67
67 -
 68
68 -
 69
69 -
 70
70 -
 71
71 -
 72
72 -
 73
73 -
 74
74 -
 75
75 -
 76
76 -
 77
77 -
 78
78 -
79
-
80
-
81
-
82
-
83
-
84
-
85
-
86
-
87
-
88
-
89
-
90
-
91
-
92
-
93
-
94
-
95
-
96
-
97
-
98
-
99
-
100
-
101
-
102
-
103
-
104
-
105
-
106
-
107
-
108
-
109
-
110
-
111
-
112
-
113
-
114
-
115
-
116
-
117
-
118
-
119
-
120
-
121
-
122
-
123
-
124
-
125
-
126
-
127
-
128
-
129
-
130
-
131
-
132
-
133
-
134
-
135
-
136
-
137
-
138
-
139
-
140
-
141
-
142
-
143
-
144
-
145
-
146
-
147
-
148
-
149
-
150
-
151
-
152
-
153
-
154
-
155
-
156
-
157
-
158
-
159
-
160
-
161
-
162
-
163
-
164
-
165
-
166
-
167
-
168
-
169
-
170
-
171
-
172
-
173
-
174
-
175
-
176
-
177
-
178
-
179
-
180
-
181
-
182
-
183
-
184
-
185
-
186
-
187
-
188
-
189
-
190
-
191
-
192
-
193
-
194
-
195
-
196
-
197
-
198
-
199
-
200
-
201
-
202
-
203
-
204
-
205
-
206
-
207
-
208
-
209
-
210
-
211
-
212
-
213
-
214
-
215
-
216
-
217
-
218
-
219
-
220
-
221
-
222
-
223
-
224
-
225
-
226
-
227
-
228
-
229
-
230
-
231
-
232
-
233
-
234
-
235
-
236
-
237
-
238
-
239
-
240
-
241
-
242
-
243
-
244
-
245
-
246
-
247
-
248
-
249
-
250
-
251
-
252
-
253
-
254
-
255
-
256
-
257
-
258
-
259
-
260
-
261
-
262
-
263
-
264
-
265
-
266
-
267
-
268
-
269
-
270
-
271
-
272
-
273
-
274
-
275
-
276
-
277
-
278
-
279
-
280
 |
 |

R
ESIDENTIAL
M
ORTGAGE
-B
ACKED
S
ECURITIES
At December 31, 2012, our residential mortgage-backed
securities portfolio was comprised of $31.4 billion fair value
of US government agency-backed securities and $6.1 billion
fair value of non-agency (private issuer) securities. The
agency securities are generally collateralized by 1-4 family,
conforming, fixed-rate residential mortgages.The non-agency
securities are also generally collateralized by 1-4 family
residential mortgages. The mortgage loans underlying the
non-agency securities are generally non-conforming
(i.e., original balances in excess of the amount qualifying for
agency securities) and predominately have interest rates that
are fixed for a period of time, after which the rate adjusts to a
floating rate based upon a contractual spread that is indexed to
a market rate (i.e., a “hybrid ARM”), or interest rates that are
fixed for the term of the loan.
Substantially all of the non-agency securities are senior
tranches in the securitization structure and at origination had
credit protection in the form of credit enhancement, over-
collateralization and/or excess spread accounts.
During 2012, we recorded OTTI credit losses of $99 million
on non-agency residential mortgage-backed securities. All of
the losses were associated with securities rated below
investment grade. As of December 31, 2012, the noncredit
portion of impairment recorded in Accumulated other
comprehensive income for non-agency residential mortgage-
backed securities for which we have recorded an OTTI credit
loss totaled $150 million and the related securities had a fair
value of $3.7 billion.
The fair value of sub-investment grade investment securities
for which we have not recorded an OTTI credit loss as of
December 31, 2012 totaled $1.9 billion, with unrealized net
gains of $114 million.
C
OMMERCIAL
M
ORTGAGE
-B
ACKED
S
ECURITIES
The fair value of the non-agency commercial mortgage-
backed securities portfolio was $5.9 billion at December 31,
2012 and consisted of fixed-rate, private-issuer securities
collateralized by non-residential properties, primarily retail
properties, office buildings, and multi-family housing. The
agency commercial mortgage-backed securities portfolio was
$2.0 billion fair value at December 31, 2012 consisting of
multi-family housing. Substantially all of the securities are the
most senior tranches in the subordination structure.
There were no OTTI credit losses on commercial mortgage-
backed securities during 2012.
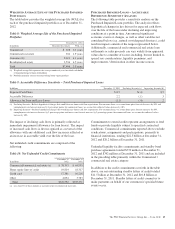
A
SSET
-B
ACKED
S
ECURITIES
The fair value of the asset-backed securities portfolio was $6.5
billion at December 31, 2012 and consisted of fixed-rate and
floating-rate, private-issuer securities collateralized primarily
by various consumer credit products, including residential
mortgage loans, credit cards, automobile loans, and student
loans. Substantially all of the securities are senior tranches in
the securitization structure and have credit protection in the
form of credit enhancement, over-collateralization and/or
excess spread accounts.
We recorded OTTI credit losses of $11 million on asset-
backed securities during 2012. All of the securities are
collateralized by first lien and second lien residential
mortgage loans and are rated below investment grade. As of
December 31, 2012, the noncredit portion of impairment
recorded in Accumulated other comprehensive income for
asset-backed securities for which we have recorded an OTTI
credit loss totaled $52 million and the related securities had a
fair value of $603 million.
For the sub-investment grade investment securities (available
for sale and held to maturity) for which we have not recorded
an OTTI loss through December 31, 2012, the fair value was
$47 million, with unrealized net losses of $3 million. The
results of our security-level assessments indicate that we will
recover the cost basis of these securities.
Note 8 Investment Securities in the Notes To Consolidated
Financial Statements in Item 8 of this Report provides
additional information on OTTI losses and further detail
regarding our process for assessing OTTI.
If current housing and economic conditions were to worsen,
and if market volatility and illiquidity were to worsen, or if
market interest rates were to increase appreciably, the
valuation of our investment securities portfolio could be
adversely affected and we could incur additional OTTI credit
losses that would impact our Consolidated Income Statement.
L
OANS
H
ELD FOR
S
ALE
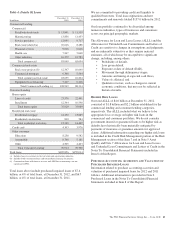
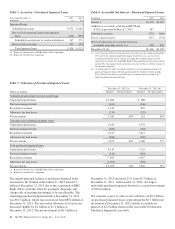
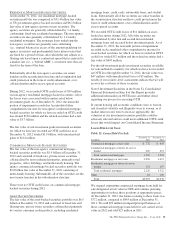
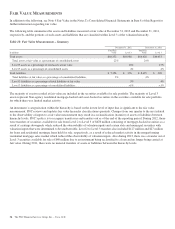
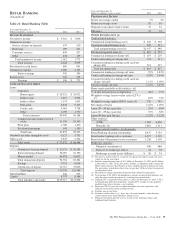
Table 15: Loans Held For Sale
In millions
December 31
2012
December 31
2011
Commercial mortgages at fair value $ 772 $ 843
Commercial mortgages at lower of cost or
market 620 451
Total commercial mortgages 1,392 1,294
Residential mortgages at fair value 2,096 1,415
Residential mortgages at lower of cost or
market 124 107
Total residential mortgages 2,220 1,522
Other 81 120
Total $3,693 $2,936
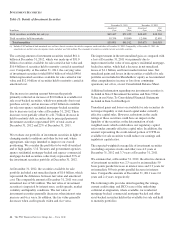
We stopped originating commercial mortgage loans held for
sale designated at fair value in 2008 and continue pursuing
opportunities to reduce these positions at appropriate prices.
At December 31, 2012, the balance relating to these loans was
$772 million, compared to $843 million at December 31,
2011. We sold $32 million in unpaid principal balances of
these commercial mortgage loans held for sale carried at fair
value in 2012 and sold $25 million in 2011.
The PNC Financial Services Group, Inc. – Form 10-K 49