PNC Bank 2012 Annual Report Download - page 55
Download and view the complete annual report
Please find page 55 of the 2012 PNC Bank annual report below. You can navigate through the pages in the report by either clicking on the pages listed below, or by using the keyword search tool below to find specific information within the annual report.-
 1
1 -
2
-
3
-
4
-
5
-
6
-
7
-
8
-
9
-
10
-
11
-
12
-
13
-
14
-
15
-
16
-
17
-
18
-
19
-
20
-
21
-
22
-
23
-
24
-
25
-
26
-
27
-
28
-
29
-
30
-
31
-
32
-
33
-
34
-
35
-
36
-
37
-
38
-
39
-
40
-
41
-
42
-
43
-
44
-
 45
45 -
 46
46 -
 47
47 -
 48
48 -
 49
49 -
 50
50 -
 51
51 -
 52
52 -
 53
53 -
 54
54 -
 55
55 -
 56
56 -
 57
57 -
 58
58 -
 59
59 -
 60
60 -
 61
61 -
 62
62 -
 63
63 -
 64
64 -
 65
65 -
66
-
67
-
68
-
69
-
70
-
71
-
72
-
73
-
74
-
75
-
76
-
77
-
78
-
79
-
80
-
81
-
82
-
83
-
84
-
85
-
86
-
87
-
88
-
89
-
90
-
91
-
92
-
93
-
94
-
95
-
96
-
97
-
98
-
99
-
100
-
101
-
102
-
103
-
104
-
105
-
106
-
107
-
108
-
109
-
110
-
111
-
112
-
113
-
114
-
115
-
116
-
117
-
118
-
119
-
120
-
121
-
122
-
123
-
124
-
125
-
126
-
127
-
128
-
129
-
130
-
131
-
132
-
133
-
134
-
135
-
136
-
137
-
138
-
139
-
140
-
141
-
142
-
143
-
144
-
145
-
146
-
147
-
148
-
149
-
150
-
151
-
152
-
153
-
154
-
155
-
156
-
157
-
158
-
159
-
160
-
161
-
162
-
163
-
164
-
165
-
166
-
167
-
168
-
169
-
170
-
171
-
172
-
173
-
174
-
175
-
176
-
177
-
178
-
179
-
180
-
181
-
182
-
183
-
184
-
185
-
186
-
187
-
188
-
189
-
190
-
191
-
192
-
193
-
194
-
195
-
196
-
197
-
198
-
199
-
200
-
201
-
202
-
203
-
204
-
205
-
206
-
207
-
208
-
209
-
210
-
211
-
212
-
213
-
214
-
215
-
216
-
217
-
218
-
219
-
220
-
221
-
222
-
223
-
224
-
225
-
226
-
227
-
228
-
229
-
230
-
231
-
232
-
233
-
234
-
235
-
236
-
237
-
238
-
239
-
240
-
241
-
242
-
243
-
244
-
245
-
246
-
247
-
248
-
249
-
250
-
251
-
252
-
253
-
254
-
255
-
256
-
257
-
258
-
259
-
260
-
261
-
262
-
263
-
264
-
265
-
266
-
267
-
268
-
269
-
270
-
271
-
272
-
273
-
274
-
275
-
276
-
277
-
278
-
279
-
280
 |
 |
C
REDIT
Q
UALITY
H
IGHLIGHTS
• Overall credit quality improved during 2012.
• Nonperforming assets of $3.8 billion at
December 31, 2012 decreased 9 percent compared to
December 31, 2011. The decrease in nonperforming
assets from December 31, 2011 was primarily
attributable to decreases in commercial real estate
and commercial nonperforming loans. This decrease
was partially offset by the acquisition of RBC Bank
(USA) and higher nonperforming home equity loans
from a change in policy for home equity loans past
due 90 days being placed on nonaccrual status,
compared to a prior policy of past due 180 days.
Additionally, pursuant to regulatory guidance issued
in the third quarter of 2012, nonperforming consumer
loans increased related to changes in treatment of
certain loans classified as TDRs resulting from
bankruptcy. Of these loans, approximately 78% were
current on their payments as of December 31, 2012.
Further detail is included in the Credit Risk
Management portion of the Risk Management section
of this Item 7.
• Accruing loans past due 90 days or more of $2.4
billion at December 31, 2012 decreased $.6 billion,
or 21 percent, from December 31, 2011, primarily
due to a decline in government insured delinquent
residential real estate loans, a decline in delinquent
home equity loans due to a change in policy for home
equity loans past due 90 days being placed on
nonaccrual status, compared to prior policy of past
due 180 days, and a decrease in non government
insured residential real estate loans pursuant to
regulatory guidance issued in the third quarter of
2012 related to changes in treatment of certain loans
classified as TDRs resulting from bankruptcy.
Further detail is included in the Credit Risk
Management portion of the Risk Management section
of this Item 7.
• Net charge-offs of $1.3 billion for 2012 were down
21 percent compared to net charge-offs of $1.6
billion for 2011. The allowance for loan and lease
losses was 2.17% of total loans and 124% of
nonperforming loans at December 31, 2012,
compared with 2.73% and 122% at December 31,
2011, respectively.
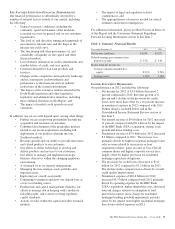
B
ALANCE
S
HEET
H
IGHLIGHTS
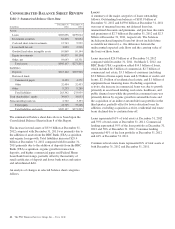
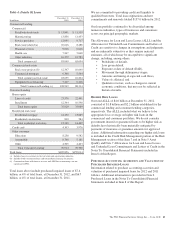
• Total loans increased by $27 billion, or 17 percent, to
$186 billion at December 31, 2012 compared to $159
billion at December 31, 2011.
• Total commercial lending increased by $20.6
billion, or 23 percent, from December 31,
2011, due to strong organic growth and the
impact from the RBC Bank (USA) acquisition.
• Total consumer lending increased $6.2 billion,
or 9 percent, from December 31, 2011
primarily in home equity and automobile loans,
including the impact from the RBC Bank
(USA) acquisition.
• Total deposits were $213 billion at December 31,
2012 compared with $188 billion at December 31,
2011.
• Transaction deposits increased to $177 billion
at December 31, 2012 compared to $148 billion
at December 31, 2011, including the impact
from the RBC Bank (USA) acquisition as well
as organic transaction deposit growth from
increases in both consumer and commercial
liquidity. Transaction deposits were 83%
percent of total deposits at December 31, 2012,
reflecting our strong customer focus and core
strategy to grow checking relationships.
• Retail certificates of deposit declined by $5.7
billion at December 31, 2012 from
December 31, 2011 due to runoff of maturing
accounts.
• As of February 22, 2013, deposits have
declined by approximately 2.7% from the
December 31, 2012 level as a result of seasonal
and normal business activity. Deposit
fluctuations due to the Transaction Account
Guarantee Program’s expiration have not been
significant. Management expects that in the
current interest rate environment, additional
deposit runoff will not be significant.
• PNC’s balance sheet remained core funded with a
loans to deposits ratio of 87 percent at December 31,
2012 and retained a strong bank holding company
liquidity position.
• Trust preferred securities and hybrid capital
securities redeemed in 2012 totaled $2.3 billion with
a weighted average rate of 8.3 percent, effectively
lowering funding costs.
• PNC issued approximately $2 billion of preferred
stock in 2012 with a weighted average rate of 5.9
percent.
• PNC had strong capital levels at December 31, 2012
with a Tier 1 common capital ratio of 9.6 percent
compared to 10.3 percent at December 31, 2011,
which reflected a decrease of approximately 1.2
percentage points from the acquisition of RBC Bank
(USA), partially offset by retention of earnings.
• PNC’s estimated proforma Basel III Tier 1 common
capital ratio was 7.5 percent at December 31, 2012
without benefit of phase-ins, based on current
understanding of Basel III proposed rules, estimates
of Basel II (with proposed modifications) risk-
weighted assets, and application of Basel II.5 rules.
PNC’s goal is to be within a Basel III Tier 1 common
capital ratio range of between 8.0 to 8.5 percent by
year end 2013 without benefit of phase-ins. We
believe we are positioned to reach this goal.
• In April 2012 the PNC board of directors raised the
quarterly cash dividend on common stock to 40 cents
36 The PNC Financial Services Group, Inc. – Form 10-K