PNC Bank 2012 Annual Report Download - page 122
Download and view the complete annual report
Please find page 122 of the 2012 PNC Bank annual report below. You can navigate through the pages in the report by either clicking on the pages listed below, or by using the keyword search tool below to find specific information within the annual report.-
 1
1 -
2
-
3
-
4
-
5
-
6
-
7
-
8
-
9
-
10
-
11
-
12
-
13
-
14
-
15
-
16
-
17
-
18
-
19
-
20
-
21
-
22
-
23
-
24
-
25
-
26
-
27
-
28
-
29
-
30
-
31
-
32
-
33
-
34
-
35
-
36
-
37
-
38
-
39
-
40
-
41
-
42
-
43
-
44
-
45
-
46
-
47
-
48
-
49
-
50
-
51
-
52
-
53
-
54
-
55
-
56
-
57
-
58
-
59
-
60
-
61
-
62
-
63
-
64
-
65
-
66
-
67
-
68
-
69
-
70
-
71
-
72
-
73
-
74
-
75
-
76
-
77
-
78
-
79
-
80
-
81
-
82
-
83
-
84
-
85
-
86
-
87
-
88
-
89
-
90
-
91
-
92
-
93
-
94
-
95
-
96
-
97
-
98
-
99
-
100
-
101
-
102
-
103
-
104
-
105
-
106
-
107
-
108
-
109
-
110
-
111
-
 112
112 -
 113
113 -
 114
114 -
 115
115 -
 116
116 -
 117
117 -
 118
118 -
 119
119 -
 120
120 -
 121
121 -
 122
122 -
 123
123 -
 124
124 -
 125
125 -
 126
126 -
 127
127 -
 128
128 -
 129
129 -
 130
130 -
 131
131 -
 132
132 -
133
-
134
-
135
-
136
-
137
-
138
-
139
-
140
-
141
-
142
-
143
-
144
-
145
-
146
-
147
-
148
-
149
-
150
-
151
-
152
-
153
-
154
-
155
-
156
-
157
-
158
-
159
-
160
-
161
-
162
-
163
-
164
-
165
-
166
-
167
-
168
-
169
-
170
-
171
-
172
-
173
-
174
-
175
-
176
-
177
-
178
-
179
-
180
-
181
-
182
-
183
-
184
-
185
-
186
-
187
-
188
-
189
-
190
-
191
-
192
-
193
-
194
-
195
-
196
-
197
-
198
-
199
-
200
-
201
-
202
-
203
-
204
-
205
-
206
-
207
-
208
-
209
-
210
-
211
-
212
-
213
-
214
-
215
-
216
-
217
-
218
-
219
-
220
-
221
-
222
-
223
-
224
-
225
-
226
-
227
-
228
-
229
-
230
-
231
-
232
-
233
-
234
-
235
-
236
-
237
-
238
-
239
-
240
-
241
-
242
-
243
-
244
-
245
-
246
-
247
-
248
-
249
-
250
-
251
-
252
-
253
-
254
-
255
-
256
-
257
-
258
-
259
-
260
-
261
-
262
-
263
-
264
-
265
-
266
-
267
-
268
-
269
-
270
-
271
-
272
-
273
-
274
-
275
-
276
-
277
-
278
-
279
-
280
 |
 |
in the first quarter of 2010), and the exchange by the US
Treasury of the TARP warrant issued to it on December 31,
2008 into warrants, each to purchase one share of PNC
common stock at an exercise price of $67.33, sold by the US
Treasury in a secondary public offering in May 2010. These
common stock warrants will expire December 31, 2018.
Status of Credit Ratings
The cost and availability of short-term and long-term funding,
as well as collateral requirements for certain derivative
instruments, is influenced by PNC’s debt ratings.
In general, rating agencies base their ratings on many
quantitative and qualitative factors, including capital
adequacy, liquidity, asset quality, business mix, level and
quality of earnings, and the current legislative and regulatory
environment, including implied government support. In
addition, rating agencies themselves have been subject to
scrutiny arising from the financial crisis and could make or be
required to make substantial changes to their ratings policies
and practices, particularly in response to legislative and
regulatory changes, including as a result of provisions in
Dodd-Frank. Potential changes in the legislative and
regulatory environment and the timing of those changes could
impact our ratings, which as noted above, could impact our
liquidity and financial condition. A decrease, or potential
decrease, in credit ratings could impact access to the capital
markets and/or increase the cost of debt, and thereby
adversely affect liquidity and financial condition.
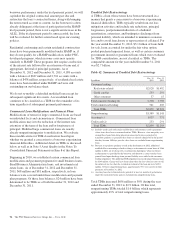
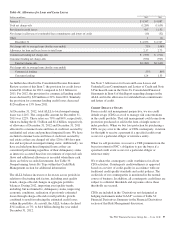
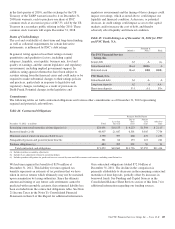
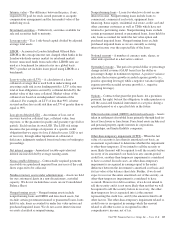
Table 45: Credit Ratings as of December 31, 2012 for PNC
and PNC Bank, N.A.
Moody’s
Standard &
Poor’s Fitch
The PNC Financial Services
Group, Inc.
Senior debt A3 A- A+
Subordinated debt Baa1 BBB+ A
Preferred stock Baa3 BBB BBB-
PNC Bank, N.A.
Subordinated debt A3 A- A
Long-term deposits A2 A AA-
Short-term deposits P-1 A-1 F1+
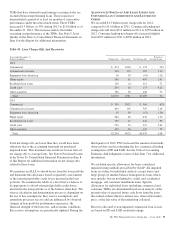
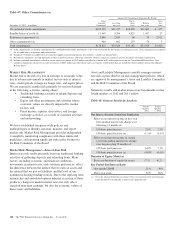
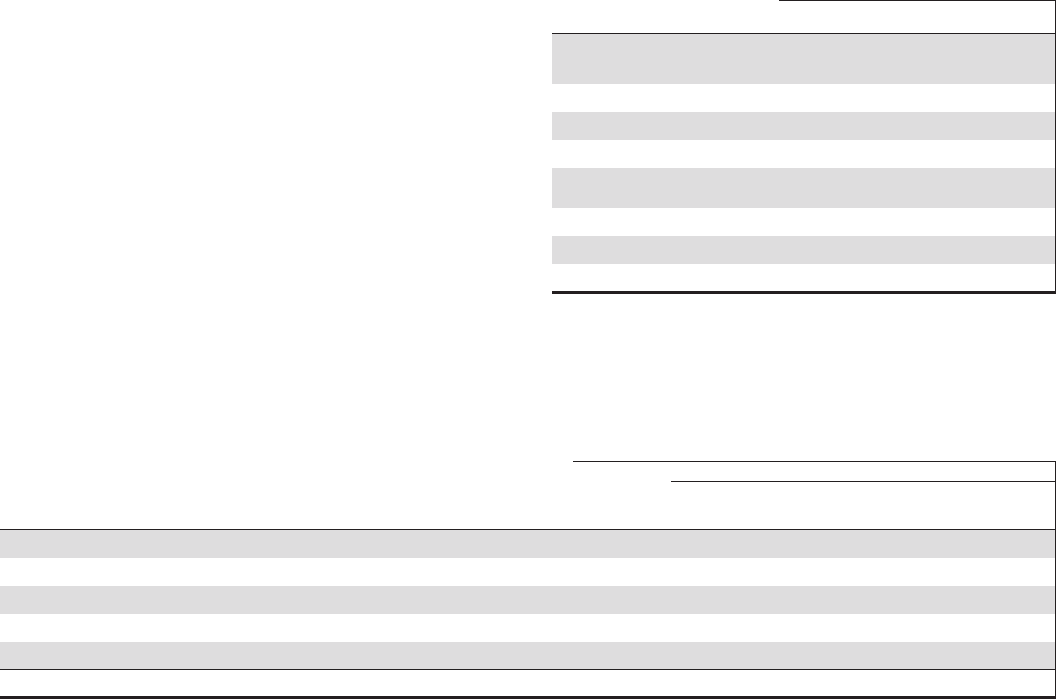
Commitments
The following tables set forth contractual obligations and various other commitments as of December 31, 2012 representing
required and potential cash outflows.
Table 46: Contractual Obligations
Payment Due By Period
December 31, 2012 – in millions Total
Less than
one year
One to
three
years
Four to
five
years
After five
years
Remaining contractual maturities of time deposits (a) $26,091 $18,155 $ 4,223 $1,598 $ 2,115
Borrowed funds (a) (b) 40,907 21,647 6,501 5,005 7,754
Minimum annual rentals on noncancellable leases 2,790 397 668 472 1,253
Nonqualified pension and postretirement benefits 581 66 133 121 261
Purchase obligations (c) 683 395 201 56 31
Total contractual cash obligations $71,052 $40,660 $11,726 $7,252 $11,414
(a) Includes purchase accounting adjustments.
(b) Includes basis adjustment relating to accounting hedges.
(c) Includes purchase obligations for goods and services covered by noncancellable contracts and contracts including cancellation fees.
We had unrecognized tax benefits of $176 million at
December 31, 2012. This liability for unrecognized tax
benefits represents an estimate of tax positions that we have
taken in our tax returns which ultimately may not be sustained
upon examination by taxing authorities. Since the ultimate
amount and timing of any future cash settlements cannot be
predicted with reasonable certainty, this estimated liability has
been excluded from the contractual obligations table. See Note
21 Income Taxes in the Notes To Consolidated Financial
Statements in Item 8 of this Report for additional information.
Our contractual obligations totaled $72.0 billion at
December 31, 2011. The decline in the comparison is
primarily attributable to decreases in the remaining contractual
maturities of time deposits, partially offset by increases in
borrowed funds. See Funding and Capital Sources in the
Consolidated Balance Sheet Review section of this Item 7 for
additional information regarding our funding sources.
The PNC Financial Services Group, Inc. – Form 10-K 103