PNC Bank 2012 Annual Report Download - page 81
Download and view the complete annual report
Please find page 81 of the 2012 PNC Bank annual report below. You can navigate through the pages in the report by either clicking on the pages listed below, or by using the keyword search tool below to find specific information within the annual report.-
 1
1 -
2
-
3
-
4
-
5
-
6
-
7
-
8
-
9
-
10
-
11
-
12
-
13
-
14
-
15
-
16
-
17
-
18
-
19
-
20
-
21
-
22
-
23
-
24
-
25
-
26
-
27
-
28
-
29
-
30
-
31
-
32
-
33
-
34
-
35
-
36
-
37
-
38
-
39
-
40
-
41
-
42
-
43
-
44
-
45
-
46
-
47
-
48
-
49
-
50
-
51
-
52
-
53
-
54
-
55
-
56
-
57
-
58
-
59
-
60
-
61
-
62
-
63
-
64
-
65
-
66
-
67
-
68
-
69
-
70
-
 71
71 -
 72
72 -
 73
73 -
 74
74 -
 75
75 -
 76
76 -
 77
77 -
 78
78 -
 79
79 -
 80
80 -
 81
81 -
 82
82 -
 83
83 -
 84
84 -
 85
85 -
 86
86 -
 87
87 -
 88
88 -
 89
89 -
 90
90 -
 91
91 -
92
-
93
-
94
-
95
-
96
-
97
-
98
-
99
-
100
-
101
-
102
-
103
-
104
-
105
-
106
-
107
-
108
-
109
-
110
-
111
-
112
-
113
-
114
-
115
-
116
-
117
-
118
-
119
-
120
-
121
-
122
-
123
-
124
-
125
-
126
-
127
-
128
-
129
-
130
-
131
-
132
-
133
-
134
-
135
-
136
-
137
-
138
-
139
-
140
-
141
-
142
-
143
-
144
-
145
-
146
-
147
-
148
-
149
-
150
-
151
-
152
-
153
-
154
-
155
-
156
-
157
-
158
-
159
-
160
-
161
-
162
-
163
-
164
-
165
-
166
-
167
-
168
-
169
-
170
-
171
-
172
-
173
-
174
-
175
-
176
-
177
-
178
-
179
-
180
-
181
-
182
-
183
-
184
-
185
-
186
-
187
-
188
-
189
-
190
-
191
-
192
-
193
-
194
-
195
-
196
-
197
-
198
-
199
-
200
-
201
-
202
-
203
-
204
-
205
-
206
-
207
-
208
-
209
-
210
-
211
-
212
-
213
-
214
-
215
-
216
-
217
-
218
-
219
-
220
-
221
-
222
-
223
-
224
-
225
-
226
-
227
-
228
-
229
-
230
-
231
-
232
-
233
-
234
-
235
-
236
-
237
-
238
-
239
-
240
-
241
-
242
-
243
-
244
-
245
-
246
-
247
-
248
-
249
-
250
-
251
-
252
-
253
-
254
-
255
-
256
-
257
-
258
-
259
-
260
-
261
-
262
-
263
-
264
-
265
-
266
-
267
-
268
-
269
-
270
-
271
-
272
-
273
-
274
-
275
-
276
-
277
-
278
-
279
-
280
 |
 |

C
ORPORATE
&I
NSTITUTIONAL
B
ANKING
(Unaudited)
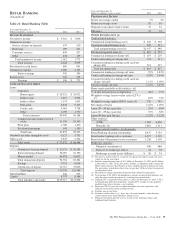
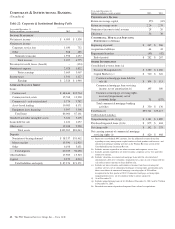
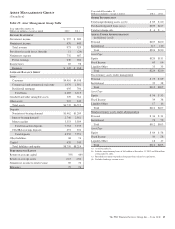
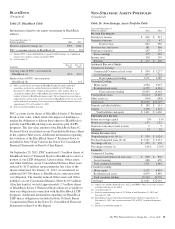
Table 22: Corporate & Institutional Banking Table
Year ended December 31
Dollars in millions, except as noted 2012 2011
I
NCOME
S
TATEMENT
Net interest income $ 4,099 $ 3,538
Noninterest income
Corporate service fees 1,030 752
Other 568 485
Noninterest income 1,598 1,237
Total revenue 5,697 4,775
Provision for credit losses (benefit) – (124)
Noninterest expense 2,028 1,832
Pretax earnings 3,669 3,067
Income taxes 1,341 1,127
Earnings $ 2,328 $ 1,940
A
VERAGE
B
ALANCE
S
HEET
Loans
Commercial $ 48,444 $35,764
Commercial real estate 15,768 13,938
Commercial – real estate related 5,774 3,782
Asset-based lending 10,083 8,171
Equipment lease financing 5,997 5,506
Total loans 86,066 67,161
Goodwill and other intangible assets 3,656 3,405
Loans held for sale 1,222 1,257
Other assets 12,018 9,220
Total assets $102,962 $81,043
Deposits
Noninterest-bearing demand $ 38,337 $31,462
Money market 15,590 12,925
Other 6,108 5,651
Total deposits 60,035 50,038
Other liabilities 17,969 13,323
Capital 9,272 8,010
Total liabilities and equity $ 87,276 $71,371
Year ended December 31
Dollars in millions, except as noted 2012 2011
P
ERFORMANCE
R
ATIOS
Return on average capital 25% 24%
Return on average assets 2.26 2.39
Noninterest income to total revenue 28 26
Efficiency 36 38
C
OMMERCIAL
M
ORTGAGE
S
ERVICING
P
ORTFOLIO
(in billions)
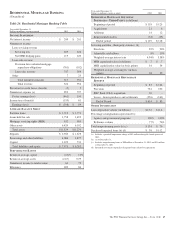
Beginning of period $ 267 $ 266
Acquisitions/additions 64 43
Repayments/transfers (49) (42)
End of period $ 282 $ 267
O
THER
I
NFORMATION
Consolidated revenue from: (a)
Treasury Management (b) $ 1,380 $ 1,266
Capital Markets (c) $ 710 $ 622
Commercial mortgage loans held for
sale (d) $ 104 $ 113
Commercial mortgage loan servicing
income, net of amortization (e) 195 180
Commercial mortgage servicing rights
recovery/(impairment), net of
economic hedge 31 (157)
Total commercial mortgage banking
activities $ 330 $ 136
Total loans (f) $93,721 $73,417
Credit-related statistics:
Nonperforming assets (f) (g) $ 1,181 $ 1,889
Purchased impaired loans (f) (h) $ 875 $ 404
Net charge-offs $ 142 $ 375
Net carrying amount of commercial mortgage
servicing rights (f) $ 420 $ 468
(a) Represents consolidated PNC amounts. See the additional revenue discussion
regarding treasury management, capital markets-related products and services, and
commercial mortgage banking activities in the Product Revenue section of the
Consolidated Income Statement Review.
(b) Includes amounts reported in net interest income and corporate service fees.
(c) Includes amounts reported in net interest income, corporate service fees and other
noninterest income.
(d) Includes valuations on commercial mortgage loans held for sale and related
commitments, derivative valuations, origination fees, gains on sale of loans held for
sale and net interest income on loans held for sale.
(e) Includes net interest income and noninterest income from loan servicing and
ancillary services, net of commercial mortgage servicing rights amortization and a
direct write-down of commercial mortgage servicing rights of $24 million
recognized in the first quarter of 2012. Commercial mortgage servicing rights
(impairment)/recovery, net of economic hedge is shown separately.
(f) As of December 31.
(g) Includes nonperforming loans of $ 1.0 billion at December 31, 2012 and $1.7 billion
at December 31, 2011.
(h) Recorded investment of purchased impaired loans related to acquisitions.
62 The PNC Financial Services Group, Inc. – Form 10-K