PNC Bank 2012 Annual Report Download - page 177
Download and view the complete annual report
Please find page 177 of the 2012 PNC Bank annual report below. You can navigate through the pages in the report by either clicking on the pages listed below, or by using the keyword search tool below to find specific information within the annual report.-
 1
1 -
2
-
3
-
4
-
5
-
6
-
7
-
8
-
9
-
10
-
11
-
12
-
13
-
14
-
15
-
16
-
17
-
18
-
19
-
20
-
21
-
22
-
23
-
24
-
25
-
26
-
27
-
28
-
29
-
30
-
31
-
32
-
33
-
34
-
35
-
36
-
37
-
38
-
39
-
40
-
41
-
42
-
43
-
44
-
45
-
46
-
47
-
48
-
49
-
50
-
51
-
52
-
53
-
54
-
55
-
56
-
57
-
58
-
59
-
60
-
61
-
62
-
63
-
64
-
65
-
66
-
67
-
68
-
69
-
70
-
71
-
72
-
73
-
74
-
75
-
76
-
77
-
78
-
79
-
80
-
81
-
82
-
83
-
84
-
85
-
86
-
87
-
88
-
89
-
90
-
91
-
92
-
93
-
94
-
95
-
96
-
97
-
98
-
99
-
100
-
101
-
102
-
103
-
104
-
105
-
106
-
107
-
108
-
109
-
110
-
111
-
112
-
113
-
114
-
115
-
116
-
117
-
118
-
119
-
120
-
121
-
122
-
123
-
124
-
125
-
126
-
127
-
128
-
129
-
130
-
131
-
132
-
133
-
134
-
135
-
136
-
137
-
138
-
139
-
140
-
141
-
142
-
143
-
144
-
145
-
146
-
147
-
148
-
149
-
150
-
151
-
152
-
153
-
154
-
155
-
156
-
157
-
158
-
159
-
160
-
161
-
162
-
163
-
164
-
165
-
166
-
 167
167 -
 168
168 -
 169
169 -
 170
170 -
 171
171 -
 172
172 -
 173
173 -
 174
174 -
 175
175 -
 176
176 -
 177
177 -
 178
178 -
 179
179 -
 180
180 -
 181
181 -
 182
182 -
 183
183 -
 184
184 -
 185
185 -
 186
186 -
 187
187 -
188
-
189
-
190
-
191
-
192
-
193
-
194
-
195
-
196
-
197
-
198
-
199
-
200
-
201
-
202
-
203
-
204
-
205
-
206
-
207
-
208
-
209
-
210
-
211
-
212
-
213
-
214
-
215
-
216
-
217
-
218
-
219
-
220
-
221
-
222
-
223
-
224
-
225
-
226
-
227
-
228
-
229
-
230
-
231
-
232
-
233
-
234
-
235
-
236
-
237
-
238
-
239
-
240
-
241
-
242
-
243
-
244
-
245
-
246
-
247
-
248
-
249
-
250
-
251
-
252
-
253
-
254
-
255
-
256
-
257
-
258
-
259
-
260
-
261
-
262
-
263
-
264
-
265
-
266
-
267
-
268
-
269
-
270
-
271
-
272
-
273
-
274
-
275
-
276
-
277
-
278
-
279
-
280
 |
 |

I
MPAIRED
L
OANS
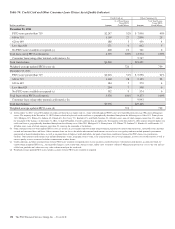
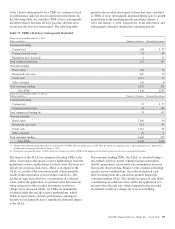
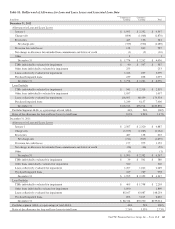
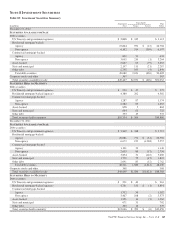
Impaired loans include commercial nonperforming loans and
consumer and commercial TDRs, regardless of nonperforming
status. Excluded from impaired loans are nonperforming
leases, loans held for sale, smaller balance homogeneous type
loans and purchased impaired loans. See Note 6 Purchased
Loans for additional information. Nonperforming equipment
lease financing loans of $12 million and $22 million at
December 31, 2012 and December 31, 2011, respectively, are
excluded from impaired loans pursuant to authoritative lease
accounting guidance. We did not recognize interest income on
nonperforming impaired loans while they were in impaired
loan status during 2012 and 2011. The following table
provides further detail on impaired loans individually
evaluated for impairment and the associated ALLL. Certain
commercial impaired loans do not have a related ALLL as the
valuation of these impaired loans exceeded the recorded
investment.
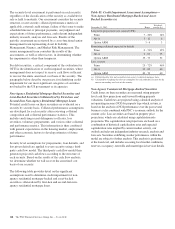
Table 74: Impaired Loans
In millions
Unpaid
Principal
Balance
Recorded
Investment
(a)
Associated
Allowance
(b)
Average
Recorded
Investment
(a)
December 31, 2012
Impaired loans with an associated allowance
Commercial $ 824 $ 523 $ 150 $ 653
Commercial real estate 851 594 143 778
Home equity (c) 1,239 1,134 328 891
Residential real estate (c) 1,094 894 168 777
Credit card (c) 204 204 48 227
Other consumer (c) 104 86 3 63
Total impaired loans with an associated allowance $4,316 $3,435 $ 840 $3,389
Impaired loans without an associated allowance
Commercial $ 362 $ 126 $ 157
Commercial real estate 562 355 400
Total impaired loans without an associated allowance $ 924 $ 481 $ 557
Total impaired loans $5,240 $3,916 $ 840 $3,946
December 31, 2011
Impaired loans with an associated allowance
Commercial $1,125 $ 785 $ 241 $ 979
Commercial real estate 1,452 1,043 318 1,247
Home equity 774 762 292 702
Residential real estate 853 730 193 609
Credit card 258 258 53 281
Other consumer 48 48 3 39
Total impaired loans with an associated allowance $4,510 $3,626 $1,100 $3,857
Impaired loans without an associated allowance
Commercial $ 347 $ 125 $ 104
Commercial real estate 592 342 413
Total impaired loans without an associated allowance $ 939 $ 467 $ 517
Total impaired loans $5,449 $4,093 $1,100 $4,374
(a) Recorded investment in a loan includes the unpaid principal balance plus accrued interest and net accounting adjustments, less any charge-offs. Recorded investment does not include
any associated valuation allowance. Average recorded investment is for the years ended December 31, 2012 and December 31, 2011.
(b) Associated allowance amounts include $587 million and $580 million for TDRs at December 31, 2012 and December 31, 2011, respectively.
(c) Pursuant to regulatory guidance issued in the third quarter of 2012, the impact of TDRs where no formal reaffirmation was provided by the borrower and therefore a concession has
been granted based upon discharge from personal liability in bankruptcy is included in the table. A portion of these loans have been written down to collateral value.
158 The PNC Financial Services Group, Inc. – Form 10-K