PNC Bank 2012 Annual Report Download - page 184
Download and view the complete annual report
Please find page 184 of the 2012 PNC Bank annual report below. You can navigate through the pages in the report by either clicking on the pages listed below, or by using the keyword search tool below to find specific information within the annual report.-
 1
1 -
2
-
3
-
4
-
5
-
6
-
7
-
8
-
9
-
10
-
11
-
12
-
13
-
14
-
15
-
16
-
17
-
18
-
19
-
20
-
21
-
22
-
23
-
24
-
25
-
26
-
27
-
28
-
29
-
30
-
31
-
32
-
33
-
34
-
35
-
36
-
37
-
38
-
39
-
40
-
41
-
42
-
43
-
44
-
45
-
46
-
47
-
48
-
49
-
50
-
51
-
52
-
53
-
54
-
55
-
56
-
57
-
58
-
59
-
60
-
61
-
62
-
63
-
64
-
65
-
66
-
67
-
68
-
69
-
70
-
71
-
72
-
73
-
74
-
75
-
76
-
77
-
78
-
79
-
80
-
81
-
82
-
83
-
84
-
85
-
86
-
87
-
88
-
89
-
90
-
91
-
92
-
93
-
94
-
95
-
96
-
97
-
98
-
99
-
100
-
101
-
102
-
103
-
104
-
105
-
106
-
107
-
108
-
109
-
110
-
111
-
112
-
113
-
114
-
115
-
116
-
117
-
118
-
119
-
120
-
121
-
122
-
123
-
124
-
125
-
126
-
127
-
128
-
129
-
130
-
131
-
132
-
133
-
134
-
135
-
136
-
137
-
138
-
139
-
140
-
141
-
142
-
143
-
144
-
145
-
146
-
147
-
148
-
149
-
150
-
151
-
152
-
153
-
154
-
155
-
156
-
157
-
158
-
159
-
160
-
161
-
162
-
163
-
164
-
165
-
166
-
167
-
168
-
169
-
170
-
171
-
172
-
173
-
 174
174 -
 175
175 -
 176
176 -
 177
177 -
 178
178 -
 179
179 -
 180
180 -
 181
181 -
 182
182 -
 183
183 -
 184
184 -
 185
185 -
 186
186 -
 187
187 -
 188
188 -
 189
189 -
 190
190 -
 191
191 -
 192
192 -
 193
193 -
 194
194 -
195
-
196
-
197
-
198
-
199
-
200
-
201
-
202
-
203
-
204
-
205
-
206
-
207
-
208
-
209
-
210
-
211
-
212
-
213
-
214
-
215
-
216
-
217
-
218
-
219
-
220
-
221
-
222
-
223
-
224
-
225
-
226
-
227
-
228
-
229
-
230
-
231
-
232
-
233
-
234
-
235
-
236
-
237
-
238
-
239
-
240
-
241
-
242
-
243
-
244
-
245
-
246
-
247
-
248
-
249
-
250
-
251
-
252
-
253
-
254
-
255
-
256
-
257
-
258
-
259
-
260
-
261
-
262
-
263
-
264
-
265
-
266
-
267
-
268
-
269
-
270
-
271
-
272
-
273
-
274
-
275
-
276
-
277
-
278
-
279
-
280
 |
 |

N
OTE
8I
NVESTMENT
S
ECURITIES
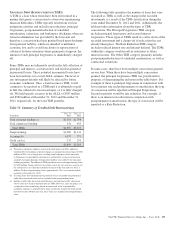
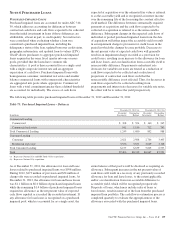
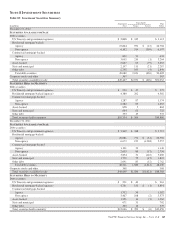
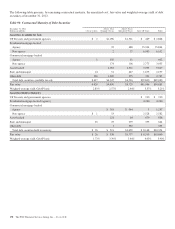
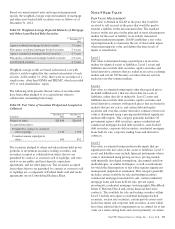
Table 83: Investment Securities Summary
Amortized
Cost
Unrealized Fair
ValueIn millions Gains Losses
December 31, 2012
S
ECURITIES
A
VAILABLE FOR
S
ALE
Debt securities
US Treasury and government agencies $ 2,868 $ 245 $ 3,113
Residential mortgage-backed
Agency 25,844 952 $ (12) 26,784
Non-agency 6,102 314 (309) 6,107
Commercial mortgage-backed
Agency 602 31 633
Non-agency 3,055 210 (1) 3,264
Asset-backed 5,667 65 (79) 5,653
State and municipal 2,197 111 (21) 2,287
Other debt 2,745 103 (4) 2,844
Total debt securities 49,080 2,031 (426) 50,685
Corporate stocks and other 367 367
Total securities available for sale $49,447 $2,031 $ (426) $51,052
S
ECURITIES
H
ELD TO
M
ATURITY
Debt securities
US Treasury and government agencies $ 230 $ 47 $ 277
Residential mortgage-backed (agency) 4,380 202 4,582
Commercial mortgage-backed
Agency 1,287 87 1,374
Non-agency 2,582 85 2,667
Asset-backed 858 5 863
State and municipal 664 61 725
Other debt 353 19 372
Total securities held to maturity $10,354 $ 506 $10,860
December 31, 2011
S
ECURITIES
A
VAILABLE FOR
S
ALE
Debt securities
US Treasury and government agencies $ 3,369 $ 348 $ 3,717
Residential mortgage-backed
Agency 26,081 772 $ (61) 26,792
Non-agency 6,673 152 (1,268) 5,557
Commercial mortgage-backed
Agency 1,101 39 1,140
Non-agency 2,693 80 (17) 2,756
Asset-backed 3,854 31 (216) 3,669
State and municipal 1,779 75 (47) 1,807
Other debt 2,691 83 (12) 2,762
Total debt securities 48,241 1,580 (1,621) 48,200
Corporate stocks and other 368 368
Total securities available for sale $48,609 $1,580 $(1,621) $48,568
S
ECURITIES
H
ELD TO
M
ATURITY
Debt securities
US Treasury and government agencies $ 221 $ 40 $ 261
Residential mortgage-backed (agency) 4,761 131 $ (1) 4,891
Commercial mortgage-backed
Agency 1,332 50 1,382
Non-agency 3,467 108 (2) 3,573
Asset-backed 1,251 14 (3) 1,262
State and municipal 671 31 702
Other debt 363 16 379
Total securities held to maturity $12,066 $ 390 $ (6) $12,450
The PNC Financial Services Group, Inc. – Form 10-K 165