PNC Bank 2012 Annual Report Download - page 216
Download and view the complete annual report
Please find page 216 of the 2012 PNC Bank annual report below. You can navigate through the pages in the report by either clicking on the pages listed below, or by using the keyword search tool below to find specific information within the annual report.-
 1
1 -
2
-
3
-
4
-
5
-
6
-
7
-
8
-
9
-
10
-
11
-
12
-
13
-
14
-
15
-
16
-
17
-
18
-
19
-
20
-
21
-
22
-
23
-
24
-
25
-
26
-
27
-
28
-
29
-
30
-
31
-
32
-
33
-
34
-
35
-
36
-
37
-
38
-
39
-
40
-
41
-
42
-
43
-
44
-
45
-
46
-
47
-
48
-
49
-
50
-
51
-
52
-
53
-
54
-
55
-
56
-
57
-
58
-
59
-
60
-
61
-
62
-
63
-
64
-
65
-
66
-
67
-
68
-
69
-
70
-
71
-
72
-
73
-
74
-
75
-
76
-
77
-
78
-
79
-
80
-
81
-
82
-
83
-
84
-
85
-
86
-
87
-
88
-
89
-
90
-
91
-
92
-
93
-
94
-
95
-
96
-
97
-
98
-
99
-
100
-
101
-
102
-
103
-
104
-
105
-
106
-
107
-
108
-
109
-
110
-
111
-
112
-
113
-
114
-
115
-
116
-
117
-
118
-
119
-
120
-
121
-
122
-
123
-
124
-
125
-
126
-
127
-
128
-
129
-
130
-
131
-
132
-
133
-
134
-
135
-
136
-
137
-
138
-
139
-
140
-
141
-
142
-
143
-
144
-
145
-
146
-
147
-
148
-
149
-
150
-
151
-
152
-
153
-
154
-
155
-
156
-
157
-
158
-
159
-
160
-
161
-
162
-
163
-
164
-
165
-
166
-
167
-
168
-
169
-
170
-
171
-
172
-
173
-
174
-
175
-
176
-
177
-
178
-
179
-
180
-
181
-
182
-
183
-
184
-
185
-
186
-
187
-
188
-
189
-
190
-
191
-
192
-
193
-
194
-
195
-
196
-
197
-
198
-
199
-
200
-
201
-
202
-
203
-
204
-
205
-
 206
206 -
 207
207 -
 208
208 -
 209
209 -
 210
210 -
 211
211 -
 212
212 -
 213
213 -
 214
214 -
 215
215 -
 216
216 -
 217
217 -
 218
218 -
 219
219 -
 220
220 -
 221
221 -
 222
222 -
 223
223 -
 224
224 -
 225
225 -
 226
226 -
227
-
228
-
229
-
230
-
231
-
232
-
233
-
234
-
235
-
236
-
237
-
238
-
239
-
240
-
241
-
242
-
243
-
244
-
245
-
246
-
247
-
248
-
249
-
250
-
251
-
252
-
253
-
254
-
255
-
256
-
257
-
258
-
259
-
260
-
261
-
262
-
263
-
264
-
265
-
266
-
267
-
268
-
269
-
270
-
271
-
272
-
273
-
274
-
275
-
276
-
277
-
278
-
279
-
280
 |
 |
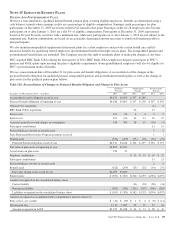
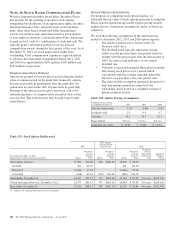
The asset category represents the allocation of Plan assets in
accordance with the investment objective of each of the Plan’s
investment managers. Certain domestic equity investment
managers utilize derivatives and fixed income securities as
described in their Investment Management Agreements to
achieve their investment objective under the Investment
Policy Statement. Other investment managers may invest in
eligible securities outside of their assigned asset category to
meet their investment objectives. The actual percentage of the
fair value of total Plan assets held as of December 31, 2012
for equity securities, fixed income securities, real estate and
all other assets are 59%, 33%, 5%, and 3%, respectively.
We believe that, over the long term, asset allocation is the
single greatest determinant of risk. Asset allocation will
deviate from the target percentages due to market movement,
cash flows, investment manager performance and
implementation of shifts under the dynamic allocation policy.
Material deviations from the asset allocation targets can alter
the expected return and risk of the Trust. On the other hand,
frequent rebalancing to the asset allocation targets may result
in significant transaction costs, which can impair the Trust’s
ability to meet its investment objective. Accordingly, the Trust
portfolio is periodically rebalanced to maintain asset
allocation within the target ranges described above.
In addition to being diversified across asset classes, the Trust
is diversified within each asset class. Secondary
diversification provides a reasonable basis for the expectation
that no single security or class of securities will have a
disproportionate impact on the total risk and return of the
Trust.
The Administrative Committee selects investment managers
for the Trust based on the contributions that their respective
investment styles and processes are expected to make to the
investment performance of the overall portfolio. The
managers’ Investment Objectives and Guidelines, which are a
part of each manager’s Investment Management Agreement,
document performance expectations and each manager’s role
in the portfolio. The Administrative Committee uses the
Investment Objectives and Guidelines to establish, guide,
control and measure the strategy and performance for each
manager.
The purpose of investment manager guidelines is to:
• Establish the investment objective and performance
standards for each manager,
• Provide the manager with the capability to evaluate
the risks of all financial instruments or other assets in
which the manager’s account is invested, and
• Prevent the manager from exposing its account to
excessive levels of risk, undesired or inappropriate
risk, or disproportionate concentration of risk.
The guidelines also indicate which investments and strategies
the manager is permitted to use to achieve its performance
objectives, and which investments and strategies it is
prohibited from using.
Where public market investment strategies may include the
use of derivatives and/or currency management, language is
incorporated in the managers’ guidelines to define allowable
and prohibited transactions and/or strategies. Derivatives are
typically employed by investment managers to modify risk/
return characteristics of their portfolio(s), implement asset
allocation changes in a cost-effective manner, or reduce
transaction costs. Under the managers’ investment guidelines,
derivatives may not be used solely for speculation or leverage.
Derivatives are to be used only in circumstances where they
offer the most efficient economic means of improving the risk/
reward profile of the portfolio.
BlackRock receives compensation for providing investment
management services. The Asset Management Group business
segment also receives compensation for payor-related
services, and received compensation for providing trustee/
custodian services prior to July 1, 2011. Compensation for
such services is paid by PNC and was not significant for 2012,
2011 or 2010. Non-affiliate service providers for the Trust are
compensated from plan assets.
F
AIR
V
ALUE
M
EASUREMENTS
As further described in Note 9 Fair Value, GAAP establishes
the framework for measuring fair value, including a hierarchy
used to classify the inputs used in measuring fair value.
A description of the valuation methodologies used for assets
measured at fair value follows. There have been no significant
changes in the valuation methodologies used at December 31,
2012 compared with those in place at December 31, 2011:
• Money market and mutual funds are valued at the net
asset value of the shares held by the pension plan at
year end.
• U.S. government and agency securities, corporate
debt, common stock and preferred stock are valued at
the closing price reported on the active market on
which the individual securities are traded. If quoted
market prices are not available for the specific
security, then fair values are estimated by using
pricing models or quoted prices of securities with
similar characteristics. Such securities are generally
classified within level 2 of the valuation hierarchy
but may be a level 3 depending on the level of
liquidity and activity in the market for the security.
• The collective trust fund investments are valued
based upon the units of such collective trust fund
held by the plan at year end multiplied by the
respective unit value. The unit value of the collective
trust fund is based upon significant observable inputs,
although it is not based upon quoted marked prices in
an active market. The underlying investments of the
collective trust funds consist primarily of equity
securities, debt obligations, short-term investments,
and other marketable securities. Due to the nature of
these securities, there are no unfunded commitments
or redemption restrictions.
The PNC Financial Services Group, Inc. – Form 10-K 197