PNC Bank 2012 Annual Report Download - page 192
Download and view the complete annual report
Please find page 192 of the 2012 PNC Bank annual report below. You can navigate through the pages in the report by either clicking on the pages listed below, or by using the keyword search tool below to find specific information within the annual report.-
 1
1 -
2
-
3
-
4
-
5
-
6
-
7
-
8
-
9
-
10
-
11
-
12
-
13
-
14
-
15
-
16
-
17
-
18
-
19
-
20
-
21
-
22
-
23
-
24
-
25
-
26
-
27
-
28
-
29
-
30
-
31
-
32
-
33
-
34
-
35
-
36
-
37
-
38
-
39
-
40
-
41
-
42
-
43
-
44
-
45
-
46
-
47
-
48
-
49
-
50
-
51
-
52
-
53
-
54
-
55
-
56
-
57
-
58
-
59
-
60
-
61
-
62
-
63
-
64
-
65
-
66
-
67
-
68
-
69
-
70
-
71
-
72
-
73
-
74
-
75
-
76
-
77
-
78
-
79
-
80
-
81
-
82
-
83
-
84
-
85
-
86
-
87
-
88
-
89
-
90
-
91
-
92
-
93
-
94
-
95
-
96
-
97
-
98
-
99
-
100
-
101
-
102
-
103
-
104
-
105
-
106
-
107
-
108
-
109
-
110
-
111
-
112
-
113
-
114
-
115
-
116
-
117
-
118
-
119
-
120
-
121
-
122
-
123
-
124
-
125
-
126
-
127
-
128
-
129
-
130
-
131
-
132
-
133
-
134
-
135
-
136
-
137
-
138
-
139
-
140
-
141
-
142
-
143
-
144
-
145
-
146
-
147
-
148
-
149
-
150
-
151
-
152
-
153
-
154
-
155
-
156
-
157
-
158
-
159
-
160
-
161
-
162
-
163
-
164
-
165
-
166
-
167
-
168
-
169
-
170
-
171
-
172
-
173
-
174
-
175
-
176
-
177
-
178
-
179
-
180
-
181
-
 182
182 -
 183
183 -
 184
184 -
 185
185 -
 186
186 -
 187
187 -
 188
188 -
 189
189 -
 190
190 -
 191
191 -
 192
192 -
 193
193 -
 194
194 -
 195
195 -
 196
196 -
 197
197 -
 198
198 -
 199
199 -
 200
200 -
 201
201 -
 202
202 -
203
-
204
-
205
-
206
-
207
-
208
-
209
-
210
-
211
-
212
-
213
-
214
-
215
-
216
-
217
-
218
-
219
-
220
-
221
-
222
-
223
-
224
-
225
-
226
-
227
-
228
-
229
-
230
-
231
-
232
-
233
-
234
-
235
-
236
-
237
-
238
-
239
-
240
-
241
-
242
-
243
-
244
-
245
-
246
-
247
-
248
-
249
-
250
-
251
-
252
-
253
-
254
-
255
-
256
-
257
-
258
-
259
-
260
-
261
-
262
-
263
-
264
-
265
-
266
-
267
-
268
-
269
-
270
-
271
-
272
-
273
-
274
-
275
-
276
-
277
-
278
-
279
-
280
 |
 |
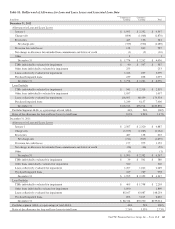
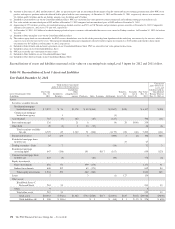
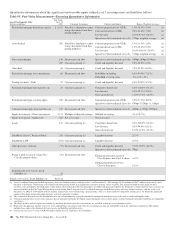
Securities are classified within the fair value hierarchy after
giving consideration to the activity level in the market for the
security type and the observability of the inputs used to
determine the fair value. When a quoted price in an active
market exists for the identical security, this price is used to
determine fair value and the security is classified within Level
1 of the hierarchy. Level 1 securities include certain U.S.
Treasury securities and exchange traded equities. When a
quoted price in an active market for the identical security is
not available, fair value is estimated using either an alternative
market approach, such as a recent trade or matrix pricing, or
an income approach, such as a discounted cash flow pricing
model. If the inputs to the valuation are based primarily on
market observable information, then the security is classified
within Level 2 of the hierarchy. Level 2 securities include
agency debt securities, agency residential mortgage-backed
securities, agency and non-agency commercial mortgage-
backed securities, asset-backed securities collateralized by
non-mortgage-related consumer loans, municipal securities,
and other debt securities. Level 2 securities are predominantly
priced by third parties, either a pricing vendor or dealer.
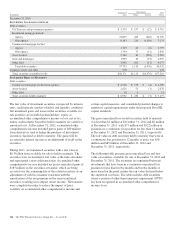
In certain cases where there is limited activity or less
transparency around the inputs to the valuation, securities are
classified within Level 3 of the hierarchy. Securities classified
as Level 3 consist primarily of non-agency residential
mortgage-backed and asset-backed securities collateralized by
first- and second-lien residential mortgage loans. Fair value
for these securities is primarily estimated using pricing
obtained from third-party vendors. In some cases, fair value is
estimated using a dealer quote, by reference to prices of
securities of a similar vintage and collateral type or by
reference to recent sales of similar securities. Market activity
for these security types is limited with little price
transparency. As a result, these securities are generally valued
by the third-party vendor using a discounted cash flow
approach that incorporates observable market activity where
available. Significant inputs to the valuation include
prepayment projections and credit loss assumptions (default
rate and loss severity) and discount rates that are deemed
representative of current market conditions. The discount rates
used incorporate a spread over the benchmark curve that takes
into consideration liquidity risk and potential credit risk not
already included in the credit loss assumptions. Significant
increases (decreases) in any of those assumptions in isolation
would result in a significantly lower (higher) fair value
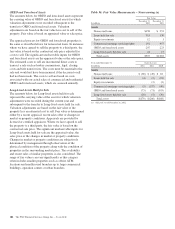
measurement. Prepayment estimates generally increase when
market interest rates decline and decrease when market
interest rates rise. Credit loss estimates are driven by the
ability of borrowers to pay their loans and housing market
prices and are impacted by changes in overall macroeconomic
conditions, typically increasing when economic conditions
worsen and decreasing when conditions improve. An increase
in the estimated prepayment rate typically results in a decrease
in estimated credit losses and vice versa. Discount rates
typically increase when market interest rates increase and/or
credit and liquidity risks increase and decrease when market
interest rates decline and/or credit and liquidity conditions
improve. Price validation procedures are performed and the
results are reviewed for these Level 3 securities by a cross-
functional Asset & Liability Management, Finance, and
Market Risk Management team. Specific price validation
procedures performed for these securities include comparing
current prices to historical pricing trends by collateral type and
vintage, comparing prices by product type to indicative
pricing grids published by market makers, and by obtaining
corroborating prices from another third-party source.
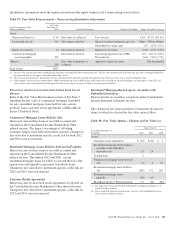
Certain infrequently traded debt securities within the State and
municipal and Other debt securities available-for-sale and
Trading securities categories are also classified in Level 3.
The significant unobservable inputs used to estimate the fair
value of these securities include an estimate of expected credit
losses and a discount for liquidity risk. These inputs are
incorporated into the fair value measurement by either
increasing the spread over the benchmark curve or by
applying a credit and liquidity discount to the par value of the
security. Significant increases (decreases) in credit and/or
liquidity risk could result in a significantly lower (higher) fair
value estimate.
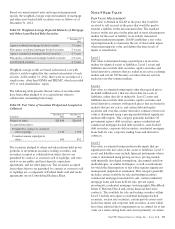
Financial Derivatives
Exchange-traded derivatives are valued using quoted market
prices and are classified as Level 1. However, the majority of
derivatives that we enter into are executed over-the-counter
and are valued using internal models. These derivatives are
primarily classified as Level 2 as the readily observable
market inputs to these models are validated to external
sources. The external sources for these inputs include industry
pricing services, or are corroborated through recent trades,
dealer quotes, yield curves, implied volatility or other market-
related data. Level 2 financial derivatives are primarily
estimated using a combination of Eurodollar future prices and
observable benchmark interest rate swaps to construct
projected discounted cash flows. Financial derivatives that are
priced using significant management judgment or assumptions
are classified as Level 3.
Fair value information for Level 3 financial derivatives is
presented separately for interest rate contracts and other
contracts. Interest rate contracts include residential and
commercial mortgage interest rate lock commitments and
certain interest rate options. Other contracts include risk
participation agreements, certain equity options and other
types of contracts.
Significant unobservable inputs for residential mortgage loan
commitments include the probability of funding and
embedded servicing. The probability of funding for residential
mortgage loan commitments represents the expected
proportion of loan commitments in the pipeline that will fund.
Additionally, embedded in the market price of the underlying
loan is a value for retaining servicing of the loan once it is
sold. Significant increases (decreases) in the fair value of a
The PNC Financial Services Group, Inc. – Form 10-K 173