PNC Bank 2012 Annual Report Download - page 88
Download and view the complete annual report
Please find page 88 of the 2012 PNC Bank annual report below. You can navigate through the pages in the report by either clicking on the pages listed below, or by using the keyword search tool below to find specific information within the annual report.-
 1
1 -
2
-
3
-
4
-
5
-
6
-
7
-
8
-
9
-
10
-
11
-
12
-
13
-
14
-
15
-
16
-
17
-
18
-
19
-
20
-
21
-
22
-
23
-
24
-
25
-
26
-
27
-
28
-
29
-
30
-
31
-
32
-
33
-
34
-
35
-
36
-
37
-
38
-
39
-
40
-
41
-
42
-
43
-
44
-
45
-
46
-
47
-
48
-
49
-
50
-
51
-
52
-
53
-
54
-
55
-
56
-
57
-
58
-
59
-
60
-
61
-
62
-
63
-
64
-
65
-
66
-
67
-
68
-
69
-
70
-
71
-
72
-
73
-
74
-
75
-
76
-
77
-
 78
78 -
 79
79 -
 80
80 -
 81
81 -
 82
82 -
 83
83 -
 84
84 -
 85
85 -
 86
86 -
 87
87 -
 88
88 -
 89
89 -
 90
90 -
 91
91 -
 92
92 -
 93
93 -
 94
94 -
 95
95 -
 96
96 -
 97
97 -
 98
98 -
99
-
100
-
101
-
102
-
103
-
104
-
105
-
106
-
107
-
108
-
109
-
110
-
111
-
112
-
113
-
114
-
115
-
116
-
117
-
118
-
119
-
120
-
121
-
122
-
123
-
124
-
125
-
126
-
127
-
128
-
129
-
130
-
131
-
132
-
133
-
134
-
135
-
136
-
137
-
138
-
139
-
140
-
141
-
142
-
143
-
144
-
145
-
146
-
147
-
148
-
149
-
150
-
151
-
152
-
153
-
154
-
155
-
156
-
157
-
158
-
159
-
160
-
161
-
162
-
163
-
164
-
165
-
166
-
167
-
168
-
169
-
170
-
171
-
172
-
173
-
174
-
175
-
176
-
177
-
178
-
179
-
180
-
181
-
182
-
183
-
184
-
185
-
186
-
187
-
188
-
189
-
190
-
191
-
192
-
193
-
194
-
195
-
196
-
197
-
198
-
199
-
200
-
201
-
202
-
203
-
204
-
205
-
206
-
207
-
208
-
209
-
210
-
211
-
212
-
213
-
214
-
215
-
216
-
217
-
218
-
219
-
220
-
221
-
222
-
223
-
224
-
225
-
226
-
227
-
228
-
229
-
230
-
231
-
232
-
233
-
234
-
235
-
236
-
237
-
238
-
239
-
240
-
241
-
242
-
243
-
244
-
245
-
246
-
247
-
248
-
249
-
250
-
251
-
252
-
253
-
254
-
255
-
256
-
257
-
258
-
259
-
260
-
261
-
262
-
263
-
264
-
265
-
266
-
267
-
268
-
269
-
270
-
271
-
272
-
273
-
274
-
275
-
276
-
277
-
278
-
279
-
280
 |
 |

B
LACK
R
OCK
(Unaudited)
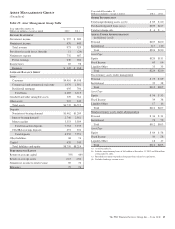
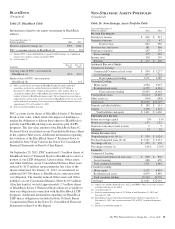
Table 25: BlackRock Table
Information related to our equity investment in BlackRock
follows:
Year ended December 31
Dollars in millions 2012 2011
Business segment earnings (a) $395 $361
PNC’s economic interest in BlackRock (b) 22 % 21%
(a) Includes PNC’s share of BlackRock’s reported GAAP earnings net of additional
income taxes on those earnings incurred by PNC.
(b) At December 31
In billions
Dec. 31
2012
Dec. 31
2011
Carrying value of PNC’s investment in
BlackRock (c) $5.6 $5.3
Market value of PNC’s investment in
BlackRock (d) 7.4 6.4
(c) PNC accounts for its investment in BlackRock under the equity method of
accounting, exclusive of a related deferred tax liability of $1.9 billion at
December 31, 2012 and $1.7 billion at December 31, 2011. In May 2012, we
exchanged 2 million shares of BlackRock Series B Preferred Stock for an equal
number of shares of BlackRock common stock. The exchange transaction had no
impact on the carrying value of our investment in BlackRock nor on our use of the
equity method of accounting. Our voting interest in BlackRock common stock was
approximately 21% at December 31, 2012.
(d) Does not include liquidity discount.
PNC accounts for its shares of BlackRock Series C Preferred
Stock at fair value, which offsets the impact of marking-to-
market the obligation to deliver these shares to BlackRock to
partially fund BlackRock long-term incentive plan (LTIP)
programs. The fair value amount of the BlackRock Series C
Preferred Stock is included on our Consolidated Balance Sheet
in the caption Other assets. Additional information regarding
the valuation of the BlackRock Series C Preferred Stock is
included in Note 9 Fair Value in the Notes To Consolidated
Financial Statements in Item 8 of this Report.
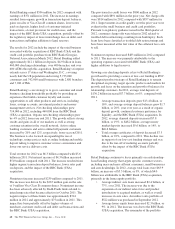
On September 29, 2011, PNC transferred 1.3 million shares of
BlackRock Series C Preferred Stock to BlackRock to satisfy a
portion of our LTIP obligation. Upon transfer, Other assets
and Other liabilities on our Consolidated Balance Sheet were
reduced by $172 million, representing the fair value of the
shares transferred. On January 31, 2013, we transferred an
additional 205,350 shares to BlackRock in connection with
our obligation. The transfer reduced Other assets and Other
liabilities on our Consolidated Balance Sheet by $33 million.
After this transfer, we hold approximately 1.3 million shares
of BlackRock Series C Preferred Stock which are available to
fund our obligation in connection with the BlackRock LTIP
programs. Additional information regarding our BlackRock
LTIP shares obligation is included in Note 16 Stock Based
Compensation Plans in the Notes To Consolidated Financial
Statements in Item 8 of this Report.
N
ON
-S
TRATEGIC
A
SSETS
P
ORTFOLIO
(Unaudited)
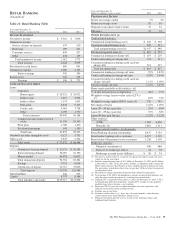
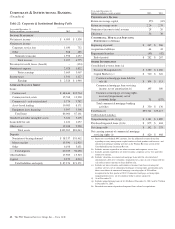
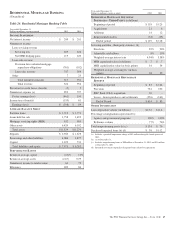
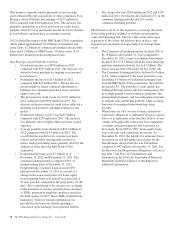
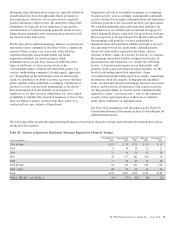
Table 26: Non-Strategic Assets Portfolio Table
Year ended December 31
Dollars in millions 2012 2011
I
NCOME
S
TATEMENT
Net interest income $ 830 $ 913
Noninterest income 13 47
Total revenue 843 960
Provision for credit losses 181 366
Noninterest expense 287 275
Pretax earnings 375 319
Income taxes 138 119
Earnings $ 237 $ 200
A
VERAGE
B
ALANCE
S
HEET
Commercial Lending:
Commercial/Commercial real estate $ 894 $ 1,277
Lease financing 677 712
Total commercial lending 1,571 1,989
Consumer Lending:
Home equity 4,584 5,257
Residential real estate 6,259 6,161
Total consumer lending 10,843 11,418
Total portfolio loans 12,414 13,407
Other assets (a) (364) (288)
Total assets $12,050 $13,119
Deposits and other liabilities $ 183 $ 111
Capital 1,238 1,319
Total liabilities and equity $ 1,421 $ 1,430
P
ERFORMANCE
R
ATIOS
Return on average capital 19% 15%
Return on average assets 1.97 1.52
Noninterest income to total revenue 2 5
Efficiency 34 29
O
THER
I
NFORMATION
Nonperforming assets (b) (c) $ 999 $ 1,024
Purchased impaired loans (b) (d) $ 5,547 $ 5,251
Net charge-offs (e) $ 299 $ 370
Net charge-off ratio (e) 2.41% 2.76%
Loans (b)
Commercial Lending
Commercial/Commercial real estate $ 665 $ 976
Lease financing 686 670
Total commercial lending 1,351 1,646
Consumer Lending
Home equity 4,237 4,930
Residential real estate 6,093 5,840
Total consumer lending 10,330 10,770
Total loans $11,681 $12,416
(a) Other assets includes deferred taxes, ALLL and OREO. Other assets were negative
in both periods due to the ALLL.
(b) As of December 31.
(c) Includes nonperforming loans of $.7 billion at both December 31, 2012 and
December 31, 2011.
(d) Recorded investment of purchased impaired loans related to acquisitions. At
December 31, 2012, this segment contained 75% of PNC’s purchased impaired
loans.
(e) For the year ended December 31.
The PNC Financial Services Group, Inc. – Form 10-K 69