PNC Bank 2012 Annual Report Download - page 224
Download and view the complete annual report
Please find page 224 of the 2012 PNC Bank annual report below. You can navigate through the pages in the report by either clicking on the pages listed below, or by using the keyword search tool below to find specific information within the annual report.-
 1
1 -
2
-
3
-
4
-
5
-
6
-
7
-
8
-
9
-
10
-
11
-
12
-
13
-
14
-
15
-
16
-
17
-
18
-
19
-
20
-
21
-
22
-
23
-
24
-
25
-
26
-
27
-
28
-
29
-
30
-
31
-
32
-
33
-
34
-
35
-
36
-
37
-
38
-
39
-
40
-
41
-
42
-
43
-
44
-
45
-
46
-
47
-
48
-
49
-
50
-
51
-
52
-
53
-
54
-
55
-
56
-
57
-
58
-
59
-
60
-
61
-
62
-
63
-
64
-
65
-
66
-
67
-
68
-
69
-
70
-
71
-
72
-
73
-
74
-
75
-
76
-
77
-
78
-
79
-
80
-
81
-
82
-
83
-
84
-
85
-
86
-
87
-
88
-
89
-
90
-
91
-
92
-
93
-
94
-
95
-
96
-
97
-
98
-
99
-
100
-
101
-
102
-
103
-
104
-
105
-
106
-
107
-
108
-
109
-
110
-
111
-
112
-
113
-
114
-
115
-
116
-
117
-
118
-
119
-
120
-
121
-
122
-
123
-
124
-
125
-
126
-
127
-
128
-
129
-
130
-
131
-
132
-
133
-
134
-
135
-
136
-
137
-
138
-
139
-
140
-
141
-
142
-
143
-
144
-
145
-
146
-
147
-
148
-
149
-
150
-
151
-
152
-
153
-
154
-
155
-
156
-
157
-
158
-
159
-
160
-
161
-
162
-
163
-
164
-
165
-
166
-
167
-
168
-
169
-
170
-
171
-
172
-
173
-
174
-
175
-
176
-
177
-
178
-
179
-
180
-
181
-
182
-
183
-
184
-
185
-
186
-
187
-
188
-
189
-
190
-
191
-
192
-
193
-
194
-
195
-
196
-
197
-
198
-
199
-
200
-
201
-
202
-
203
-
204
-
205
-
206
-
207
-
208
-
209
-
210
-
211
-
212
-
213
-
 214
214 -
 215
215 -
 216
216 -
 217
217 -
 218
218 -
 219
219 -
 220
220 -
 221
221 -
 222
222 -
 223
223 -
 224
224 -
 225
225 -
 226
226 -
 227
227 -
 228
228 -
 229
229 -
 230
230 -
 231
231 -
 232
232 -
 233
233 -
 234
234 -
235
-
236
-
237
-
238
-
239
-
240
-
241
-
242
-
243
-
244
-
245
-
246
-
247
-
248
-
249
-
250
-
251
-
252
-
253
-
254
-
255
-
256
-
257
-
258
-
259
-
260
-
261
-
262
-
263
-
264
-
265
-
266
-
267
-
268
-
269
-
270
-
271
-
272
-
273
-
274
-
275
-
276
-
277
-
278
-
279
-
280
 |
 |
N
OTE
17 F
INANCIAL
D
ERIVATIVES
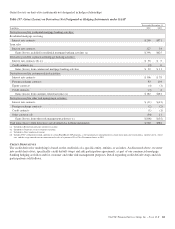
We use derivative financial instruments (derivatives)
primarily to help manage exposure to interest rate, market and
credit risk and reduce the effects that changes in interest rates
may have on net income, fair value of assets and liabilities,
and cash flows. We also enter into derivatives with customers
to facilitate their risk management activities.
Derivatives represent contracts between parties that usually
require little or no initial net investment and result in one party
delivering cash or another type of asset to the other party
based on a notional amount and an underlying as specified in
the contract. Derivative transactions are often measured in
terms of notional amount, but this amount is generally not
exchanged and it is not recorded on the balance sheet. The
notional amount is the basis to which the underlying is applied
to determine required payments under the derivative contract.
The underlying is a referenced interest rate (commonly
LIBOR), security price, credit spread or other index.
Residential and commercial real estate loan commitments
associated with loans to be sold also qualify as derivative
instruments.
All derivatives are carried on our Consolidated Balance Sheet
at fair value. Derivative balances are presented on a net basis
taking into consideration the effects of legally enforceable
master netting agreements. Cash collateral exchanged with
counterparties is also netted against the applicable derivative
fair values.
Further discussion on how derivatives are accounted for is
included in Note 1 Accounting Policies.
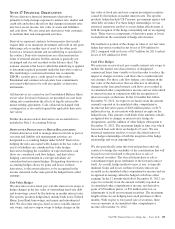
D
ERIVATIVES
D
ESIGNATED IN
H
EDGE
R
ELATIONSHIPS
Certain derivatives used to manage interest rate risk as part of
our asset and liability risk management activities are
designated as accounting hedges under GAAP. Derivatives
hedging the risks associated with changes in the fair value of
assets or liabilities are considered fair value hedges,
derivatives hedging the variability of expected future cash
flows are considered cash flow hedges, and derivatives
hedging a net investment in a foreign subsidiary are
considered net investment hedges. Designating derivatives as
accounting hedges allows for gains and losses on those
derivatives, to the extent effective, to be recognized in the
income statement in the same period the hedged items affect
earnings.
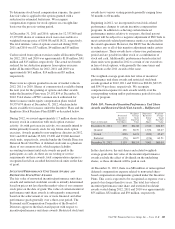
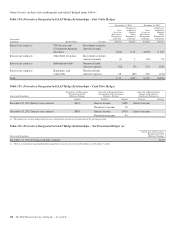
Fair Value Hedges
We enter into receive-fixed, pay-variable interest rate swaps to
hedge changes in the fair value of outstanding fixed-rate debt
and borrowings caused by fluctuations in market interest rates.
The specific products hedged may include bank notes, Federal
Home Loan Bank borrowings, and senior and subordinated
debt. We also enter into pay-fixed, receive-variable interest
rate swaps, and zero-coupon swaps to hedge changes in the
fair value of fixed rate and zero-coupon investment securities
caused by fluctuations in market interest rates. The specific
products hedged include US Treasury, government agency and
other debt securities. For these hedge relationships, we use
statistical regression analysis to assess hedge effectiveness at
both the inception of the hedge relationship and on an ongoing
basis. There were no components of derivative gains or losses
excluded from the assessment of hedge effectiveness.
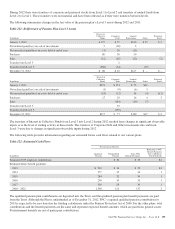
The ineffective portion of the change in value of our fair value
hedge derivatives resulted in net losses of $54 million for
2012 compared with net losses of $17 million for 2011 and net
losses of $31 million for 2010.
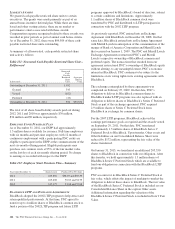
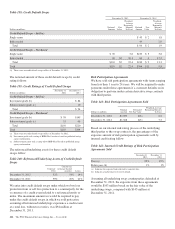
Cash Flow Hedges
We enter into receive-fixed, pay-variable interest rate swaps to
modify the interest rate characteristics of designated
commercial loans from variable to fixed in order to reduce the
impact of changes in future cash flows due to market interest
rate changes. For these cash flow hedges, any changes in the
fair value of the derivatives that are effective in offsetting
changes in the forecasted interest cash flows are recorded in
Accumulated other comprehensive income and are reclassified
to interest income in conjunction with the recognition of
interest receipts on the loans. In the 12 months that follow
December 31, 2012, we expect to reclassify from the amount
currently reported in Accumulated other comprehensive
income net derivative gains of $264 million pretax, or $171
million after-tax, in association with interest receipts on the
hedged loans. This amount could differ from amounts actually
recognized due to changes in interest rates, hedge de-
designations, and the addition of other hedges subsequent to
December 31, 2012. The maximum length of time over which
forecasted loan cash flows are hedged is 8 years. We use
statistical regression analysis to assess the effectiveness of
these hedge relationships at both the inception of the hedge
relationship and on an ongoing basis.
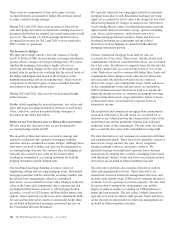
We also periodically enter into forward purchase and sale
contracts to hedge the variability of the consideration that will
be paid or received related to the purchase or sale of
investment securities. The forecasted purchase or sale is
consummated upon gross settlement of the forward contract
itself. As a result, hedge ineffectiveness, if any, is typically
minimal. Gains and losses on these forward contracts are
recorded in Accumulated other comprehensive income and are
recognized in earnings when the hedged cash flows affect
earnings. In the 12 months that follow December 31, 2012, we
expect to reclassify from the amount currently reported in
Accumulated other comprehensive income, net derivative
gains of $78 million pretax, or $51 million after-tax, as
adjustments of yield on investment securities. The maximum
length of time we are hedging forecasted purchases is three
months. With respect to forecasted sale of securities, there
were no amounts in Accumulated other comprehensive
income at December 31, 2012.
The PNC Financial Services Group, Inc. – Form 10-K 205