PNC Bank 2012 Annual Report Download - page 165
Download and view the complete annual report
Please find page 165 of the 2012 PNC Bank annual report below. You can navigate through the pages in the report by either clicking on the pages listed below, or by using the keyword search tool below to find specific information within the annual report.-
 1
1 -
2
-
3
-
4
-
5
-
6
-
7
-
8
-
9
-
10
-
11
-
12
-
13
-
14
-
15
-
16
-
17
-
18
-
19
-
20
-
21
-
22
-
23
-
24
-
25
-
26
-
27
-
28
-
29
-
30
-
31
-
32
-
33
-
34
-
35
-
36
-
37
-
38
-
39
-
40
-
41
-
42
-
43
-
44
-
45
-
46
-
47
-
48
-
49
-
50
-
51
-
52
-
53
-
54
-
55
-
56
-
57
-
58
-
59
-
60
-
61
-
62
-
63
-
64
-
65
-
66
-
67
-
68
-
69
-
70
-
71
-
72
-
73
-
74
-
75
-
76
-
77
-
78
-
79
-
80
-
81
-
82
-
83
-
84
-
85
-
86
-
87
-
88
-
89
-
90
-
91
-
92
-
93
-
94
-
95
-
96
-
97
-
98
-
99
-
100
-
101
-
102
-
103
-
104
-
105
-
106
-
107
-
108
-
109
-
110
-
111
-
112
-
113
-
114
-
115
-
116
-
117
-
118
-
119
-
120
-
121
-
122
-
123
-
124
-
125
-
126
-
127
-
128
-
129
-
130
-
131
-
132
-
133
-
134
-
135
-
136
-
137
-
138
-
139
-
140
-
141
-
142
-
143
-
144
-
145
-
146
-
147
-
148
-
149
-
150
-
151
-
152
-
153
-
154
-
 155
155 -
 156
156 -
 157
157 -
 158
158 -
 159
159 -
 160
160 -
 161
161 -
 162
162 -
 163
163 -
 164
164 -
 165
165 -
 166
166 -
 167
167 -
 168
168 -
 169
169 -
 170
170 -
 171
171 -
 172
172 -
 173
173 -
 174
174 -
 175
175 -
176
-
177
-
178
-
179
-
180
-
181
-
182
-
183
-
184
-
185
-
186
-
187
-
188
-
189
-
190
-
191
-
192
-
193
-
194
-
195
-
196
-
197
-
198
-
199
-
200
-
201
-
202
-
203
-
204
-
205
-
206
-
207
-
208
-
209
-
210
-
211
-
212
-
213
-
214
-
215
-
216
-
217
-
218
-
219
-
220
-
221
-
222
-
223
-
224
-
225
-
226
-
227
-
228
-
229
-
230
-
231
-
232
-
233
-
234
-
235
-
236
-
237
-
238
-
239
-
240
-
241
-
242
-
243
-
244
-
245
-
246
-
247
-
248
-
249
-
250
-
251
-
252
-
253
-
254
-
255
-
256
-
257
-
258
-
259
-
260
-
261
-
262
-
263
-
264
-
265
-
266
-
267
-
268
-
269
-
270
-
271
-
272
-
273
-
274
-
275
-
276
-
277
-
278
-
279
-
280
 |
 |

N
OTE
5A
SSET
Q
UALITY
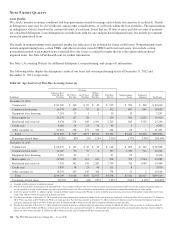
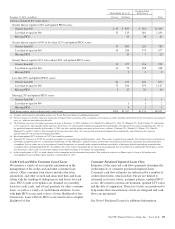
Asset Quality
We closely monitor economic conditions and loan performance trends to manage and evaluate our exposure to credit risk. Trends
in delinquency rates may be a key indicator, among other considerations, of credit risk within the loan portfolios. The measurement
of delinquency status is based on the contractual terms of each loan. Loans that are 30 days or more past due in terms of payment
are considered delinquent. Loan delinquencies exclude loans held for sale and purchased impaired loans, but include government
insured or guaranteed loans.
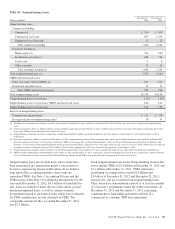
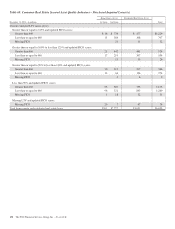
The trends in nonperforming assets represent another key indicator of the potential for future credit losses. Nonperforming assets
include nonperforming loans, certain TDRs, and other real estate owned (OREO) and foreclosed assets, but exclude certain
government insured or guaranteed loans, loans held for sale, loans accounted for under the fair value option and purchased
impaired loans. See Note 6 Purchased Loans for further information.
See Note 1 Accounting Policies for additional delinquency, nonperforming, and charge-off information.
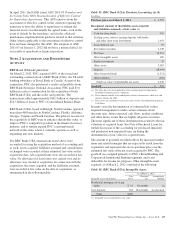
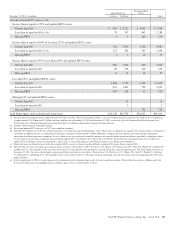
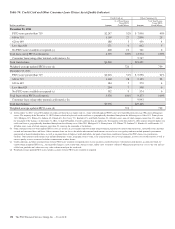
The following tables display the delinquency status of our loans and our nonperforming assets at December 31, 2012 and
December 31, 2011, respectively.
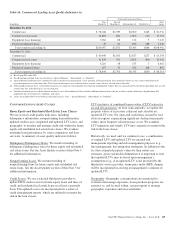
Table 64: Age Analysis of Past Due Accruing Loans (a)
Accruing
In millions
Current or Less
Than 30 Days
Past Due
30-59 Days
Past Due
60-89 Days
Past Due
90 Days
Or More
Past Due
Total Past
Due (b)
Nonperforming
Loans
Purchased
Impaired Total Loans
December 31, 2012
Commercial $ 81,930 $ 115 $ 55 $ 42 $ 212 $ 590 $ 308 $ 83,040
Commercial real estate 16,735 100 57 15 172 807 941 18,655
Equipment lease financing 7,214 17 1 2 20 13 7,247
Home equity (c) 32,174 117 58 175 951 2,620 35,920
Residential real estate (d) 8,534 278 146 1,901 2,325 845 3,536 15,240
Credit card 4,205 34 23 36 93 5 4,303
Other consumer (e) 20,663 258 131 355 744 43 1 21,451
Total $171,455 $ 919 $471 $2,351 $3,741 $3,254 $7,406 $185,856
Percentage of total loans 92.26% .49% .25% 1.26% 2.00% 1.75% 3.99% 100.00%
December 31, 2011
Commercial $ 64,437 $ 122 $ 47 $ 49 $ 218 $ 899 $ 140 $ 65,694
Commercial real estate 14,010 96 35 6 137 1,345 712 16,204
Equipment lease financing 6,367 22 5 27 22 6,416
Home equity (c) 29,288 173 114 221 508 529 2,764 33,089
Residential real estate (d) 7,935 302 176 2,281 2,759 726 3,049 14,469
Credit card 3,857 38 25 48 111 8 3,976
Other consumer (e) 18,355 265 145 368 778 31 2 19,166
Total $144,249 $1,018 $547 $2,973 $4,538 $3,560 $6,667 $159,014
Percentage of total loans 90.72% .64% .34% 1.87% 2.85% 2.24% 4.19% 100.00%
(a) Amounts in table represent recorded investment.
(b) Past due loan amounts exclude purchased impaired loans, even if contractually past due (or if we do not expect to receive payment in full based on the original contractual terms), as
we are currently accreting interest income over the expected life of the loans. Also excluded are loans held for sale and loans accounted for under the fair value option.
(c) In the first quarter of 2012, we adopted a policy stating that Home equity loans past due 90 days or more would be placed on nonaccrual status. Prior policy required that these loans
be past due 180 days before being placed on nonaccrual status.
(d) Past due loan amounts at December 31, 2012 include government insured or guaranteed residential real estate mortgages, totaling $.1 billion for 30 to 59 days past due, $.1 billion for
60 to 89 days past due and $1.9 billion for 90 days or more past due. Past due loan amounts at December 31, 2011 include government insured or guaranteed residential real estate
mortgages totaling $.1 billion for 30 to 59 days past due, $.1 billion for 60 to 89 days past due and $2.1 billion for 90 days or more past due.
(e) Past due loan amounts at December 31, 2012 include government insured or guaranteed other consumer loans totaling $.2 billion for 30 to 59 days past due, $.1 billion for 60 to 89
days past due and $.3 billion for 90 days or more past due. Past due loan amounts at December 31, 2011 include government insured or guaranteed other consumer loans totaling $.2
billion for 30 to 59 days past due, $.1 billion for 60 to 89 days past due and $.3 billion for 90 days or more past due.
146 The PNC Financial Services Group, Inc. – Form 10-K